

Image Source: Pixabay
The weakness reflected in the S&P 500 equal weight ETF in conjunction with the lousy market breadth painted a contrast with the leading index Nasdaq 100 and some of the mega-cap growth stocks.
Does it mean a crash is coming or a bull run is brewing? Watch the video below to find out how to use price volume analysis with the Wyckoff method to derive a directional bias.
Video Length: 00:08:04
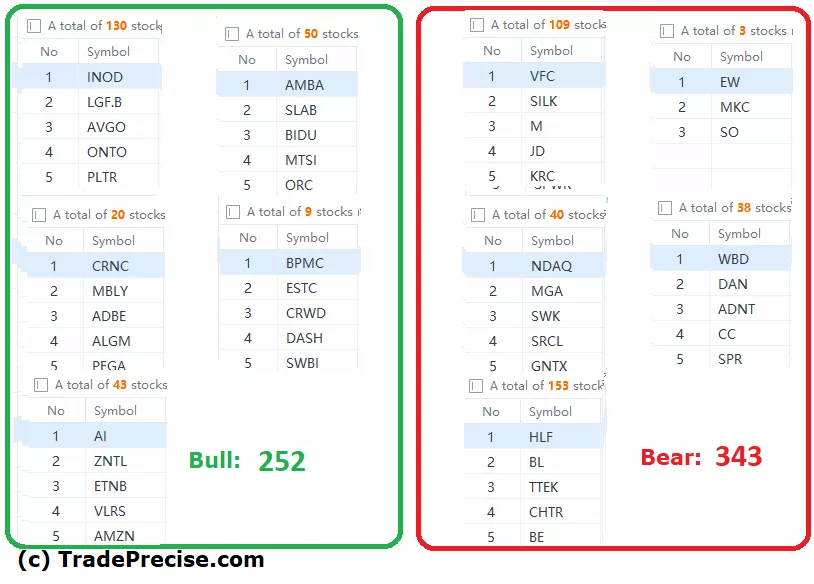
The bullish setup vs. the bearish setup is 252 to 343 from the screenshot of my stock screener below pointing to a negative market environment.
Despite there being more bearish setups than bullish setups, one can still be profitable when trading the outperforming industry groups and stocks (e.g. XLK, SMH) as long as there are valid trade entries providing a decent reward to risk.
Now is not the best time for entry for the semiconductor leaders due to overbought and overextended, but to sell into strength to scale out partially and keep trailing stop for the rest of the positions.
Based on the long/short volume in the leveraged ETF chart as discussed, there is a breakout in the momentum and a rotational play into other tech industry groups is possible until the emergence of excessive supply.
More By This Author:
Aggressive Demand Falters In S&P 500: Will A Shakeout Follow?
Using Wyckoff’s Effort Vs. Result To Unlock The S&P 500 Direction Bias For Swing & Day Trading
2023 Winning Industries: These Sectors Are Dominating The Stock Market


Comments
Log in or sign up to join the conversation.