Using Wyckoff’s Effort Vs. Result To Unlock The S&P 500 Direction Bias For Swing & Day Trading
Image Source: Unsplash
Watch the video below to find out how to use Wyckoff’s effort vs result volume spread analysis to anticipate the direction bias of the S&P 500 for short-term swing trading and day trading.
Do stay till the end to find out the leading index (and the constituents stock holdings) you should focus on.
Video Length: 00:07:36
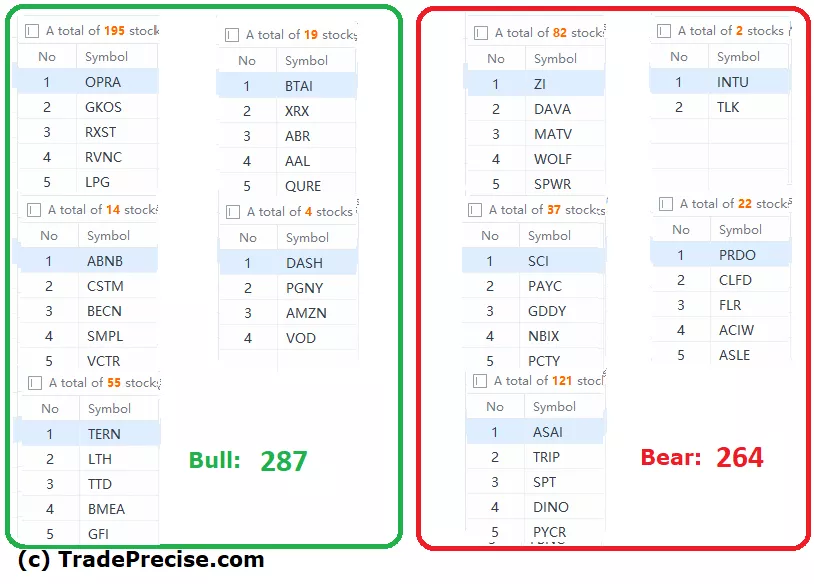
The bullish setup vs. the bearish setup is 287 to 264 from the screenshot of my stock screener below pointed a positive market environment despite a drop from last week (438 vs 160).

The outperformance in Nasdaq 100 is dependent on a handful of the heavy weight stocks. The market breadth is still neutral towards positive. A strong breakout momentum in the indices should improve the overall market breadth. The neutral market breadth together with the indices masking the weakness match the current macro picture, which is favorable to the big cap stocks.
More By This Author:
2023 Winning Industries: These Sectors Are Dominating The Stock Market
Has The Market Bottomed In Oct 2022? Check This Hint From Bloomberg
Get Ready To Ride The Bull: Price-Volume Behavior Points To A Market Breakout
Disclaimer: The information in this presentation is solely for educational purpose and should not be taken as investment advice.


