

Image Source: Unsplash
According to this price volume behavior, S&P 500 is set for a breakout to challenge the price target at 4260–4290. Watch the video below to find out how to spot this price volume pattern for supply absorption to anticipate the next big move based on the Wyckoff method.
Video Length: 00:07:40
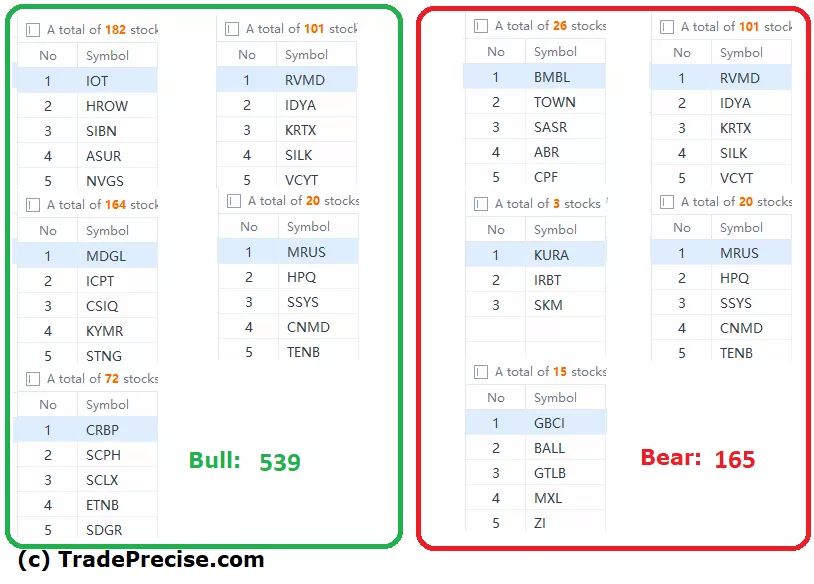
The bullish setup vs. the bearish setup is 539 to 165 from the screenshot of my stock screener below points still a positive market environment with no shortage of the trade entry setup.
The stock market breadth in my daily watchlist has been improving slightly from last week although still points towards neutral/positive. It is very constructive to see most of the breakout setups (e.g. RACE, STVN, MASI ) discussed last Tuesday during the Weekly Live Group Coaching Session (1.5 hours).
More By This Author:
Ready For S&P 500 Rally? These 2 Price Action Characteristics Could Be A Game-Changer
Eldorado Gold: The New Gold Rush After Soaring 100% In Less Than 4 Months?
S&P 500 Shows Bullish Price Volume Action Despite One Concerning Red Flag


Comments
Log in or sign up to join the conversation.