
Based on the characteristics of the pullback in S&P 500 that started last week, these tell-tale signs from the price action could mark a significant milestone for S&P 500 based on the short-term, medium term and the long term trend.
Watch the video extracted from the latest Weekly Live Group Coaching Session (1.5 hours) on 11 Apr 2023 below to find out how the bullish case could unfold and at what point will it fail and become bearish according to the Wyckoff method.
Video Length: 00:14:04
The bullish setup vs. the bearish setup is 437 to 86 from the screenshot of my stock screener below pointed still a positive market environment with no shortage of the trade entry setup.
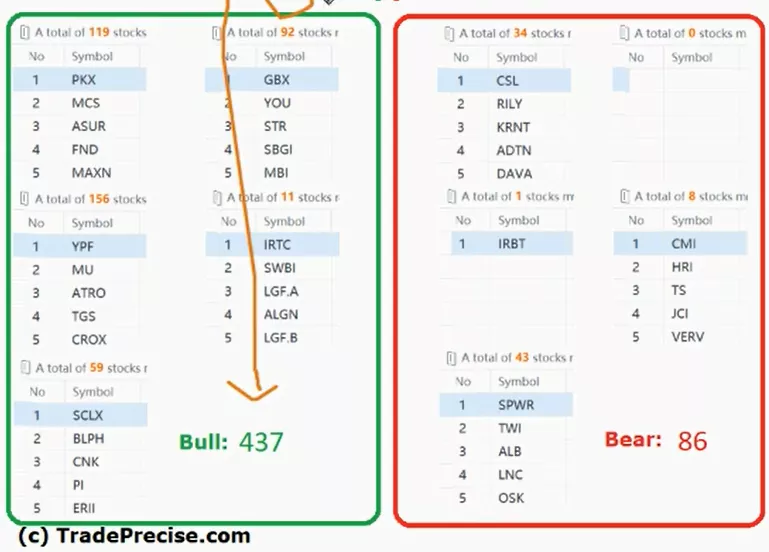
However, the 4 stock market breadth in my daily watchlist still showed neutral towards positive suggesting not an easy money-making environment yet.
More By This Author:
Eldorado Gold: The New Gold Rush After Soaring 100% In Less Than 4 Months?
S&P 500 Shows Bullish Price Volume Action Despite One Concerning Red Flag
Meta Platforms Soars 100% In Less Than 4 Months! What’s Next?


Comments
Log in or sign up to join the conversation.