
S&P 500 Shows Bullish Price Volume Action Despite One Concerning Red Flag
Although the failure scenario is unfolding after the FOMC last week, the characteristics of the pullback as reflected in the price spread and volume suggested a bullish bias for S&P 500. However, one concerning red flag could create the failure case for the bull, and traders and investors need to be aware of.
Watch the video to find out how you could anticipate for both the bullish and bearish cases together with the evolving red flag using the Wyckoff method.
Video Length: 00:12:49
The bullish setup vs. the bearish setup is 193 to 141 from the screenshot of my stock screener below pointed still a negative market environment.
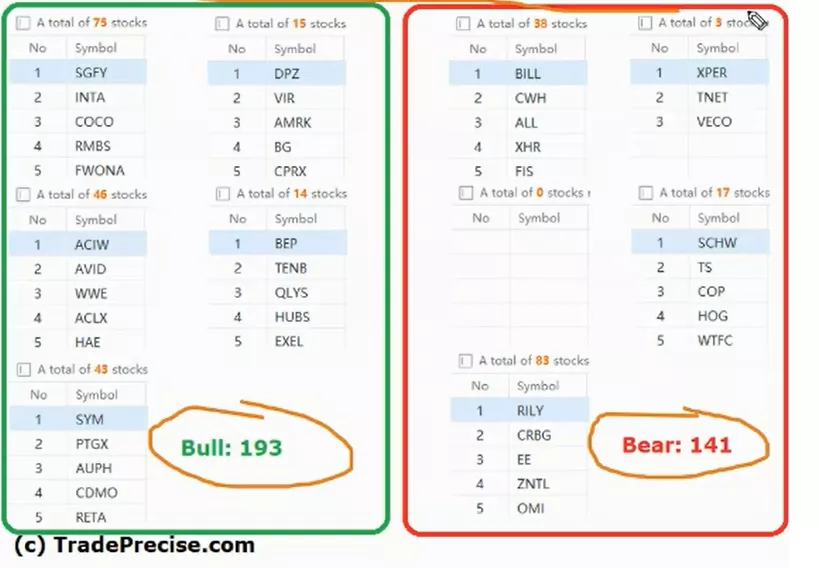
Although there are no shortage of the bullish trade entry setup, it is essential to get the bullish confirmation from the market breadth for a sustainable bull run.
More By This Author:
Meta Platforms Soars 100% In Less Than 4 Months! What’s Next?
Duolingo's Stock Is On Fire - But Can It Keep Going Amidst Economic Uncertainty?
Is Advanced Micro Devices (AMD) Stock About To Soar?
Disclaimer: The information in this presentation is solely for educational purpose and should not be taken as investment advice.


