Stock Market & Economy Recap - Saturday, Oct. 30
S&P 500 Earnings Update
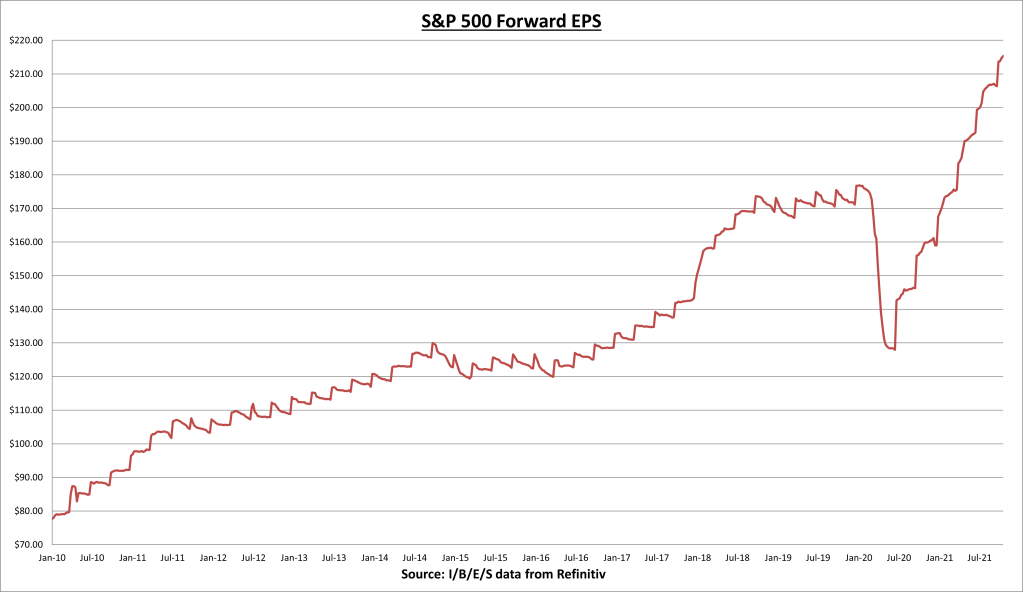
The S&P 500 earnings per share (EPS) increased to $215.32 this week. The forward EPS is now +35.4% year-to-date. Approximately 56% of the S&P 500 has now reported Q3 earnings results. 82% have beaten estimates, and results have come in a combined 10.9% above expectations.
The S&P 500 price to earnings (PE) ratio increased to 21.4, as the index rallied +1.33% this week.
The S&P 500 earnings yield is now 4.68%. With the 10-year Treasury bond rate currently at 1.56%, stocks remain attractively valued relative to fixed income alternatives.
Economic Data Review
Consumer Confidence for October came in above expectations at 113.8, +3.6% higher than last month (which was revised higher), and +12.2% higher than last year. Optimism regarding short-term business conditions remained mixed, while expectations for labor market conditions and financial prospects improved.
New home sales for September also came in above expectations - at 800 thousand sold. This is up +14% for the month, but down -17.6% from last year, as supply chain and labor issues keep production levels below potential.
The median sales price for new homes increased to $408,800, +1.8% for the month and +18.7% from last year.
The first estimate for Q3 Gross Domestic Product (GDP) came in below expectations, at a 2.0% annualized growth rate, led almost entirely by investment in private inventories. Nonetheless the economy continues to make record highs, even when adjusting for inflation.
Personal Consumption Expenditures excluding food and energy (core PCE) increased at an annualized rate of 3.6% for the fourth straight month now. You have to go back to the early 1990’s to find a time where core inflation was running this “hot,” and almost double the rate of the prior decade.
Real personal incomes excluding government transfer payments increased +0.2% for the month and +1.9% higher over the last year. Income levels are hovering around the pre-COVID-19 high point.
Summary
This was the first week where the effect of the supply chain disruptions really showed up in the data. Q3 GDP came in at 2%, while initial estimates in August were for GDP growth of +6%, and if we strip out inventory investments then GDP growth was basically 0%.
On the earnings side, many of the biggest companies in the world reported the financial effect of the disruptions. Apple (AAPL) estimated a $6 billion effect on total sales due to shortages. Thinking ahead, we have to determine how much of those lost sales are temporary, and how much is lost forever. Each industry will obviously be effected differently.
My hunch is that we’ve hit peak supply chain disruptions and things will gradual get better from here. Although it may take a long time to return to normal. This is only based on the fact that its all we are hearing about in the media these days.
It’s often the case that by the time everyone knows about a particular problem (the wall of worry), the damage that problem has caused has reached a crescendo. I could cite countless examples. Going forward, I suspect supply chains will become more flexible now that we’ve become aware of the new threat. We will learn and become better for it.
As for earnings, Q3 continues to be another solid quarter. Companies have become more efficient and have the pricing power to offset some of the lost sales. The growth rate will almost certainly slow in the first half of 2022, but slowing growth is not the same as a recession. Next week will be another important one for earnings, with roughly 1/3rd of the S&P 500 reporting results. We will gain more clarity into what the near-term future holds.
Next Week
The coming week is another very busy week for earnings, with 175 S&P 500 companies reporting. I’ll be paying attention to Fortinet (FTNT) and Square (SQ) on Thursday. For economic data, we have ISM Manufacturing PMI on Monday, ISM Services PMI and FOMC statement/press conference on Wednesday, and the BLS employment report on Friday.
I/B/E/S data is from Refinitiv.
Disclaimer: None.


