
Does size matter? Since the Pandemic, and judged by the recent performance of the Magnificent Seven and mega-cap indexes, many investors would say it matters, likely claiming that the greater the size, the better the returns. Those with data going back decades, rather than years, would also agree that size matters. However, their conclusion would be vastly different. Size matters a lot, but the smaller stocks, not the largest ones, are the better investments.
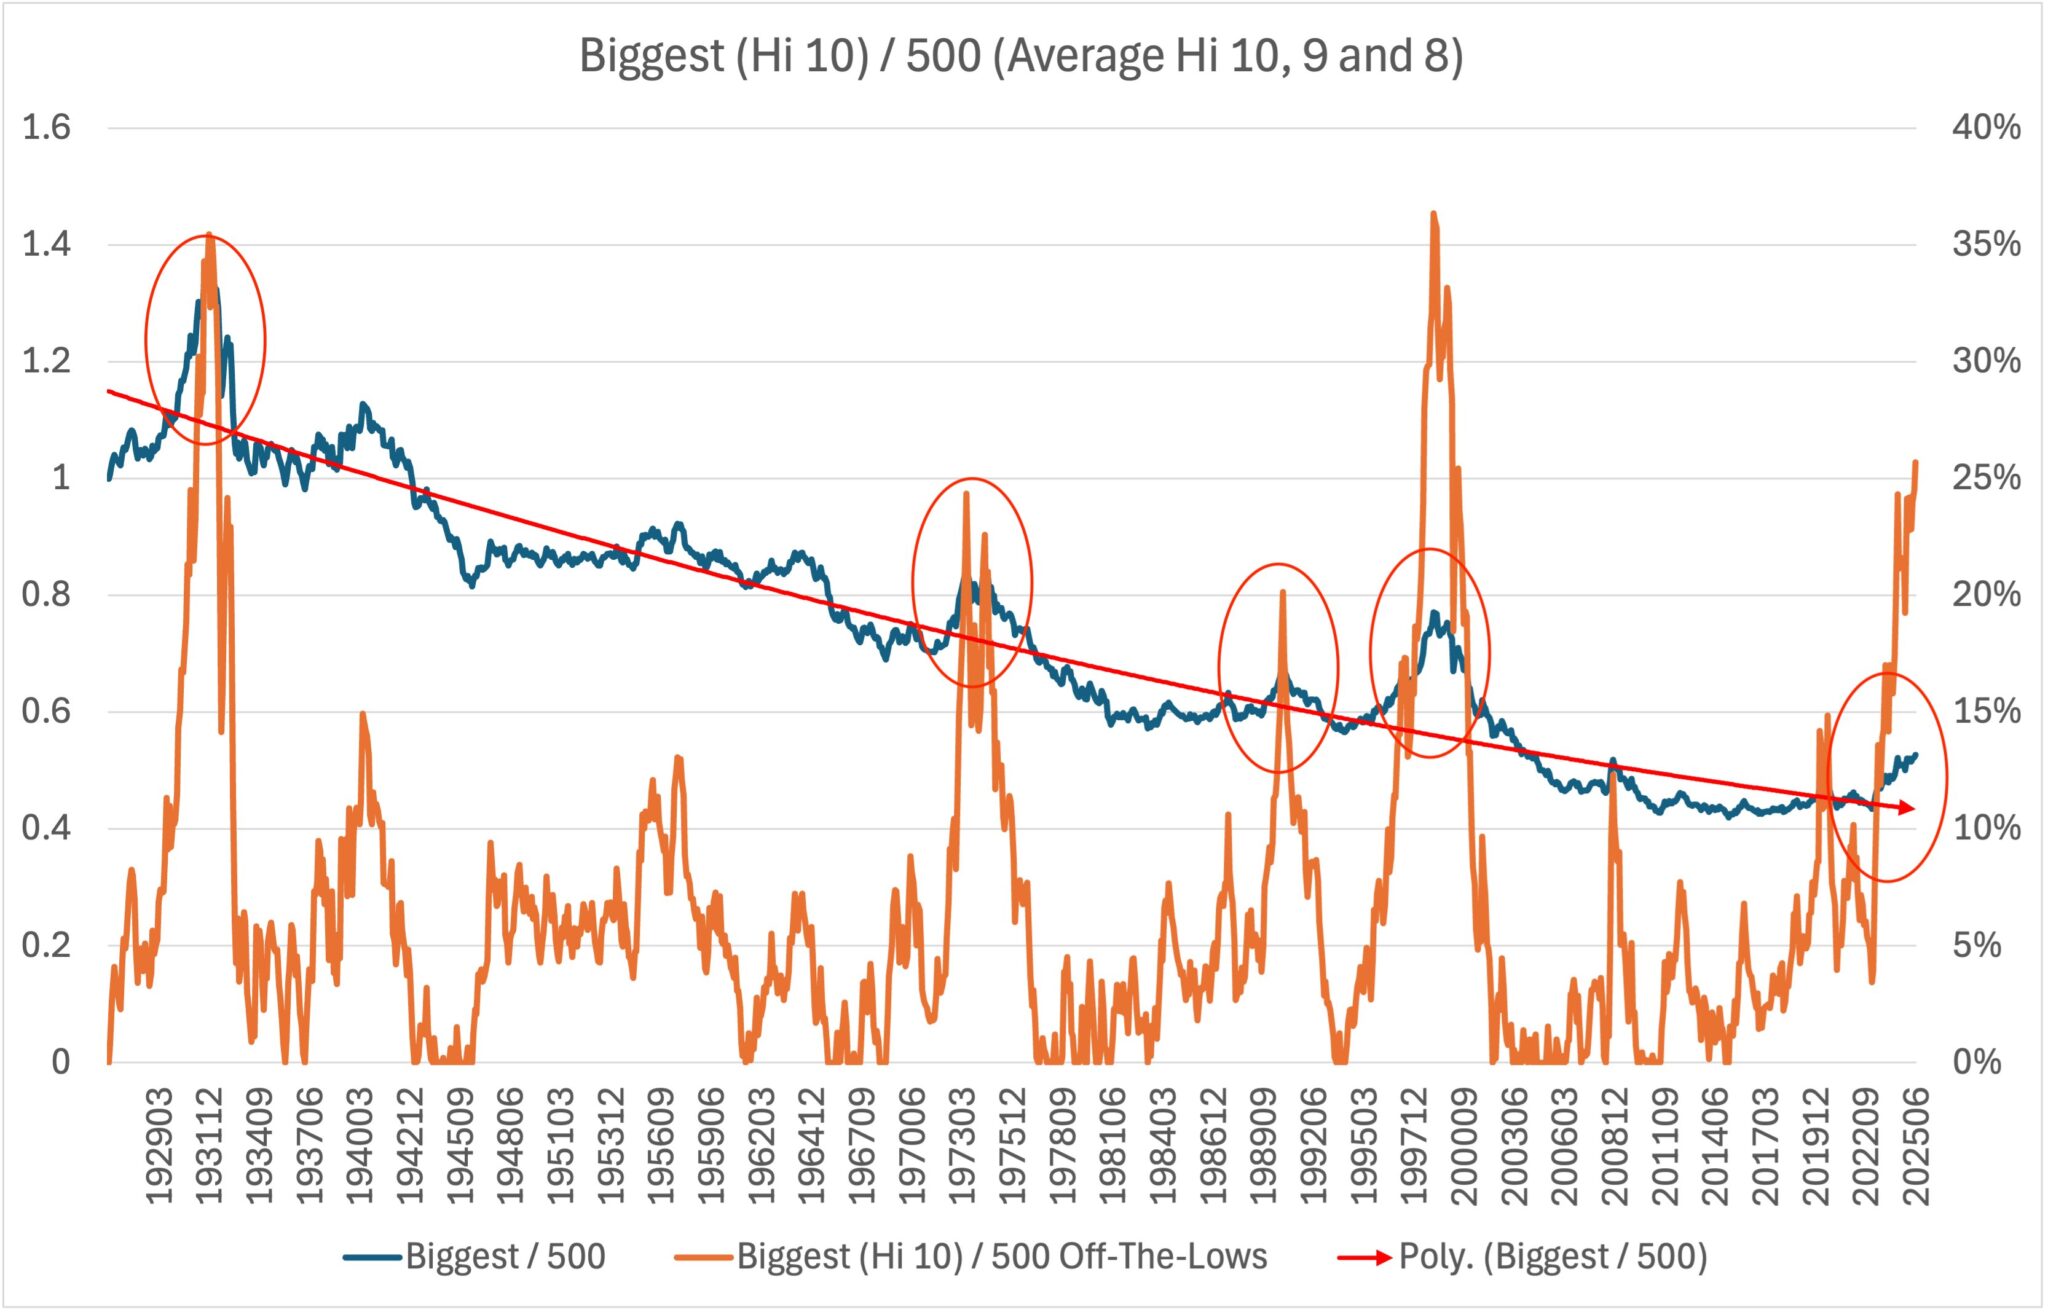
The graph below, courtesy of Tobias Carlisle, using Fama-French factor data, shows the performance of holding the top decile of stocks versus holding the average of the top three deciles. Tobias claims this is a comparison of the largest 178 stocks versus the largest 535 stocks. There are two noteworthy points worth highlighting in his graph.
- The large stocks tend to outperform the largest stocks over time. However, as he circles, there are periods lasting 5-10 years during which the largest stocks perform better.
- Over the last ten years, the largest stocks have decently outperformed the large stocks. The outperformance has been approximately 25%. The only other two instances in the last 100 years where the largest stocks performed better were in the late 1920s (35%) and the late 1990s (36%).
The graph is very concerning. However, it’s worth appreciating that the counter-trend favoring the largest stocks ma continue, and the trend may have more fuel in the tank. Like valuations in general, this graph likely portends poor relative returns for the largest stocks, but it’s not a good timing tool. We end with a quote from Tobias:
But the long-term trend is for small (535) to outperform large (178) by about 0.8% CAGR. At some point, the series returns to trend. Small and value will outperform.
What To Watch Today
Earnings
- No earnings releases today
Economy
(Click on image to enlarge)

Market Trading Update
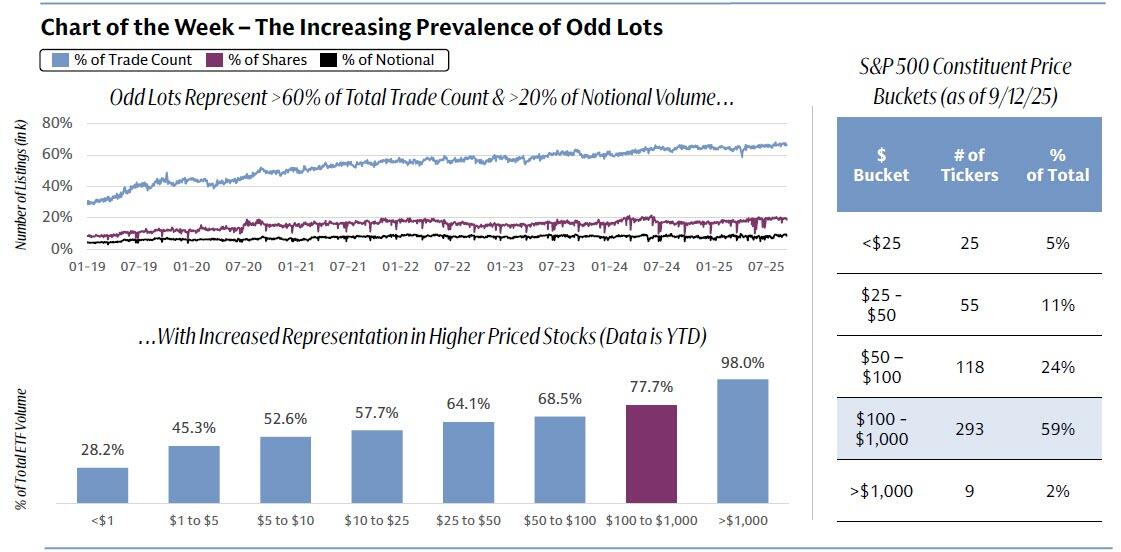
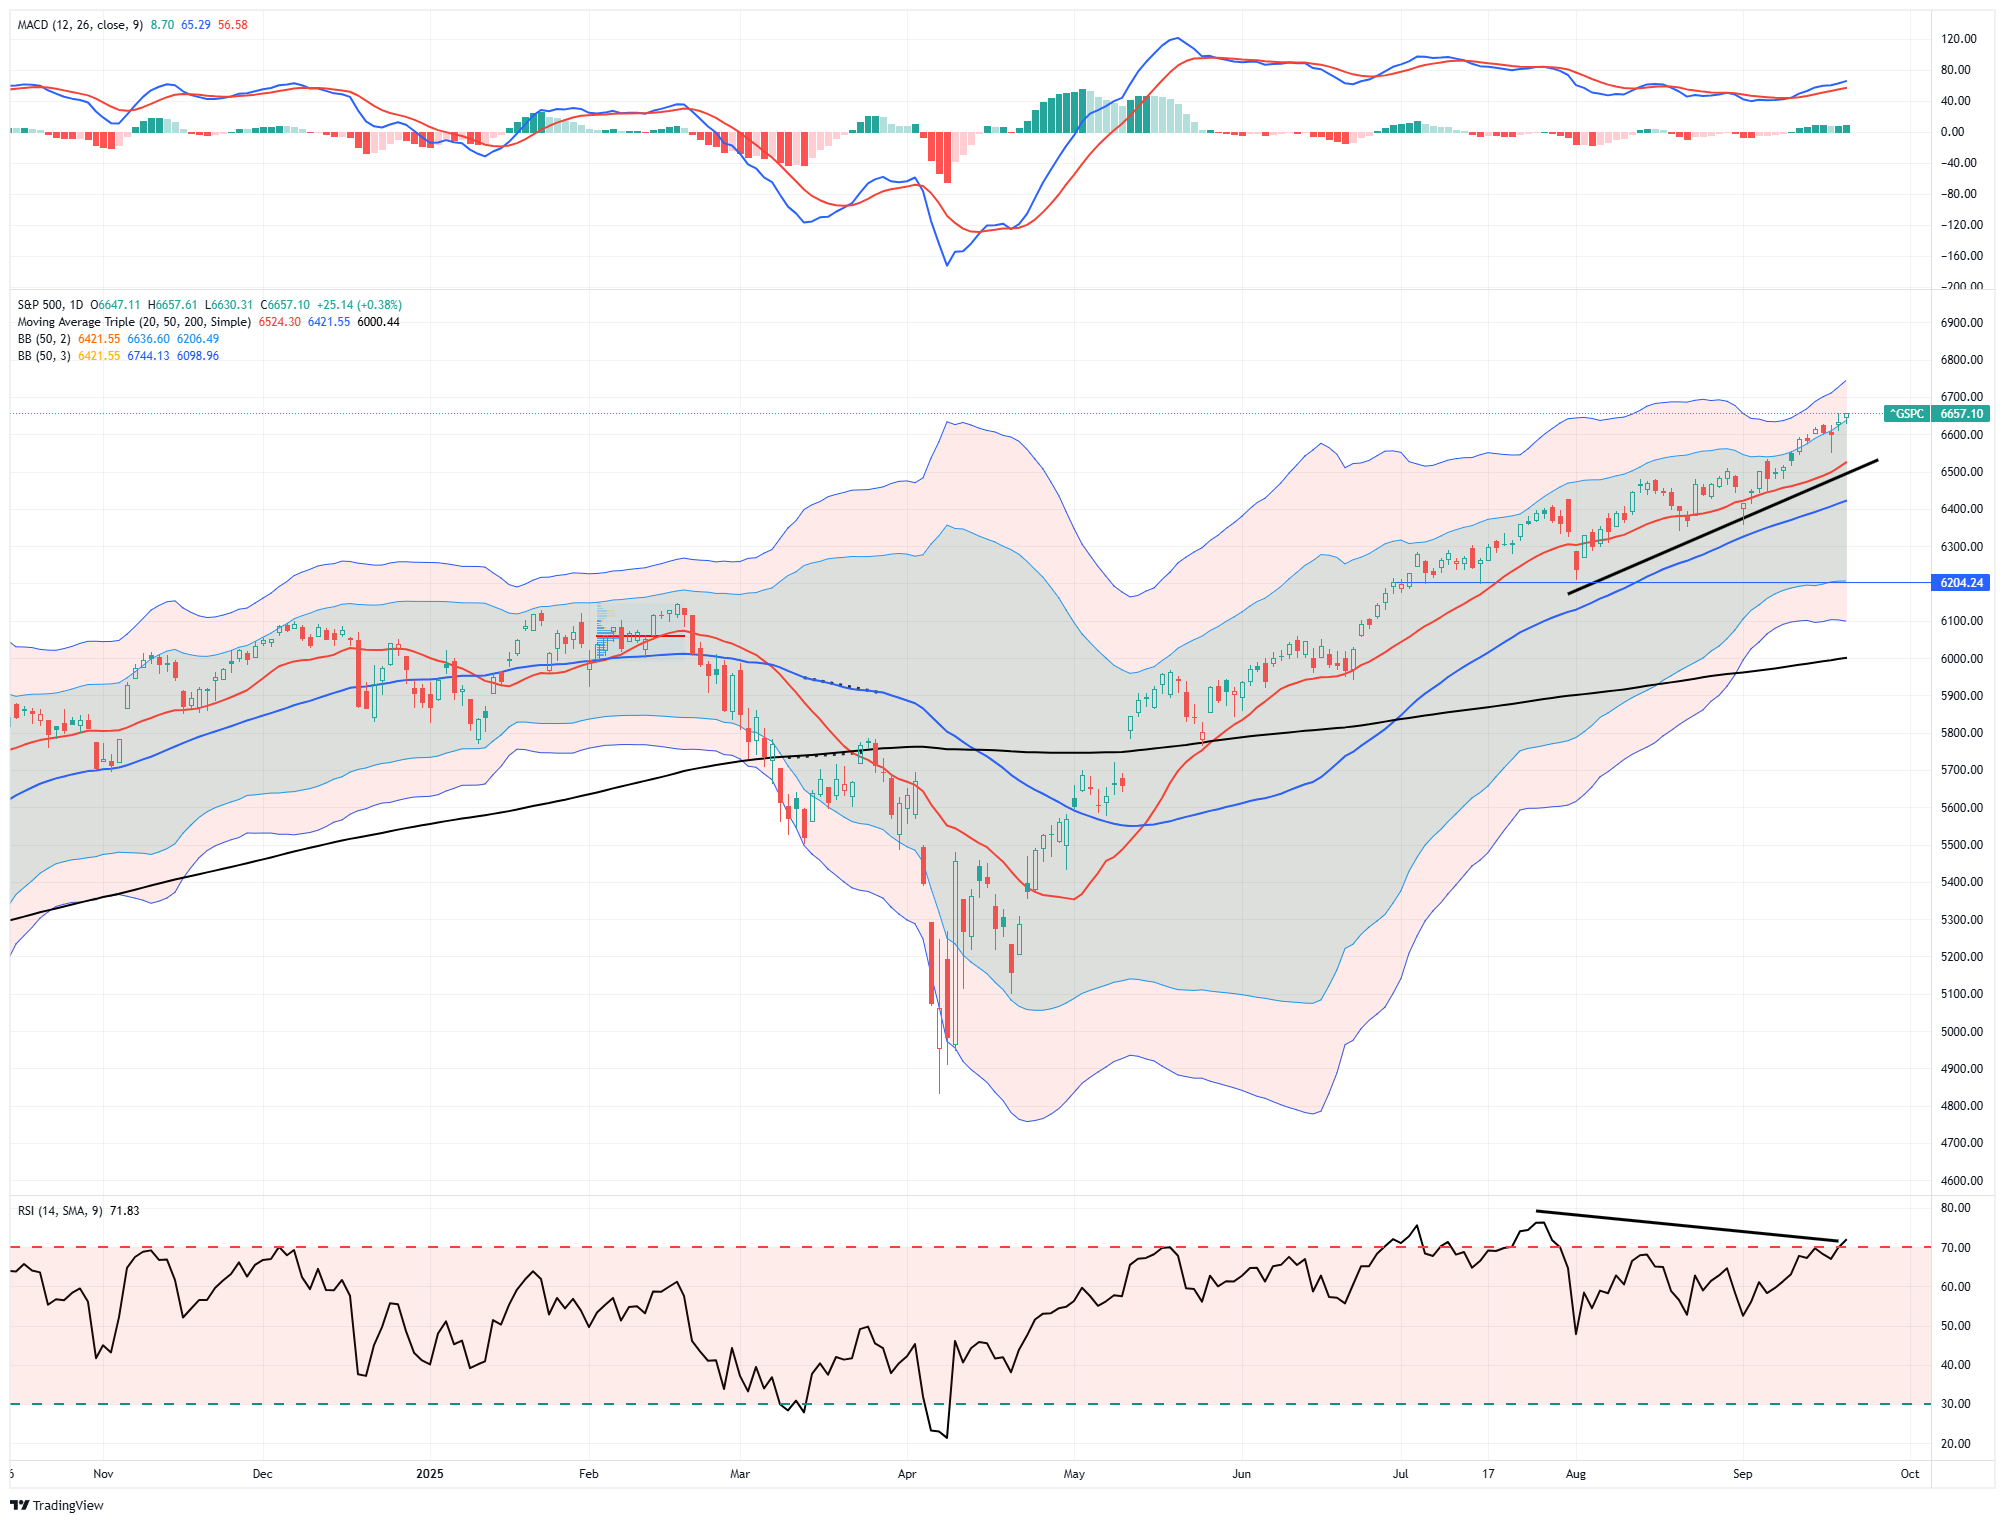
Technically, markets continue to set new all-time highs. The S&P 500 closed last week at 6652 as it continues to grind higher and trades two standard deviations above its 50-DMA. Notably, the markets have continued to push higher, driven by the Mega Cap names, but small and mid-cap stocks have also continued to post stellar gains over the last two months. The signs of a FOMO chase are evident, particularly in heavily shorted names and retail favorites. As Goldman Sachs noted in its latest weekly report, odd lots, or transactions with fewer than 100 shares of stock and a proxy for retail trading, just hit 66% of all US equity trades in Q3. That is up from only 31% in January 2019, representing more than 20% of notional volume and 8% of total executed shares!
Volatility remains unusually low. The VIX is trading around 15.6, placing it in the bottom decile of recent history. Such a backdrop is consistent with “buy-the-dip” psychology but leaves little margin for error heading into a heavy options expiration. Dealer positioning could easily magnify swings if the market breaks its tight range.
(Click on image to enlarge)
Breadth continues to be a key concern. While Wednesday’s action favored financials and cyclicals, mega-cap technology remains the dominant driver of the indices through week’s end. There were also several unusual dynamics worth highlighting. First, the negative divergence remains concerning. Historically, such divergences tend to precede short-term corrective periods. While such a correction has not occurred as of yet, it doesn’t mean that it won’t. Secondly, the deviation from the 50-dma is getting rather extreme, and also argues for at least a breather in the current advance. While none of this is bearish, it does suggest near-term risk management may be beneficial.
Support and Resistance Levels: The S&P 500’s near-term support lies at the 20-day moving average (~6,524). The 50-day moving average is roughly in the ~6,420 region but there is deeper support near ~6,200, connected with the previous pullback. Resistance is around the most recent highs in the 6,700 area (2- 3 standard deviations above the 50-DMA). Notably, volatility (as measured by VIX) remains relatively subdued. The 200-day moving average remains key support for a more significant correction. (~6000)
In short, the technical backdrop remains supportive of risk-taking. Still, with low volatility, sticky long yields, and fragile breadth, the setup argues for tighter risk management heading into next week’s data calendar.
The Week Ahead
We will be very interested this week to hear what the other members of the FOMC have to say about monetary policy. On Friday, Beth Hammack, the most hawkish member, will speak. There was one member who projected that the Fed would hike rates. Is it Beth, and if so, what is her rationale? We are also curious to see if any members were undecided and considered cutting by 50 basis points. Chairman Powell will speak on Tuesday. We suspect he will reiterate similar themes as he did in his post-FOMC meeting press conference.
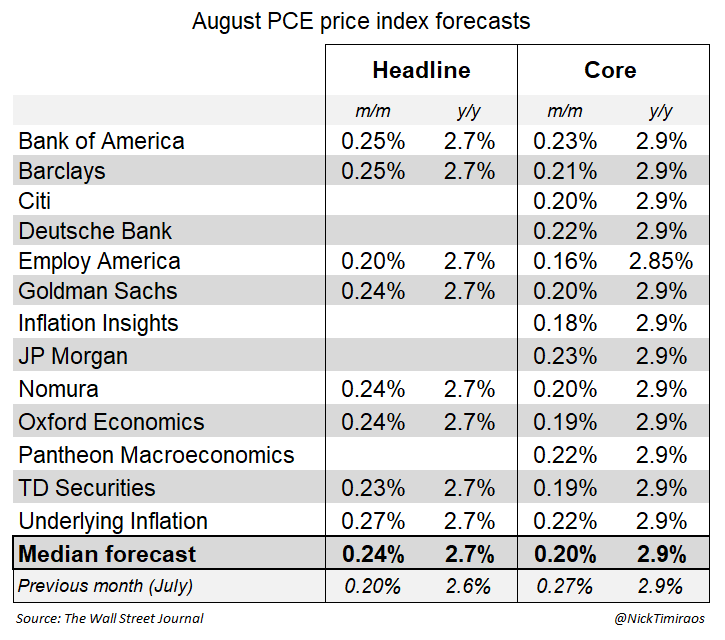
PCE prices will be released on Friday. PCE is typically easier to forecast than CPI or PPI, as much of the data used to calculate PCE is derived from those reports. As the graph below shows, the median estimate is .24% for the headline PCE figure and .20% for the core. Such a trend would continue to point to sticky inflation, but not an upward trend as some fear.
Data Centers And The Power Grid: A Path To Debt Relief?
Could data centers and the power grid be America’s next “renaissance?” With the U.S. national debt exceeding $37 trillion and interest payments surpassing defense spending, many articles have been written about the “debt doomsday” event coming. Such was a point we made in “The Debt and Deficit Problem.”
“In recent months, much debate has been about rising debt and increasing deficit levels in the U.S. For example, here is a recent headline from CNBC:”

“The article’s author suggests that U.S. federal deficits are ballooning, with spending surging due to the combined impact of tax cuts, expansive stimulus, and entitlement expenditures. Of course, with institutions like Yale, Wharton, and the CBO warning that this trend has pushed interest costs to new heights, now exceeding defense outlays, concerns about domestic solvency are rising. Even prominent figures in the media, from Larry Summers to Ray Dalio, argue that drastic action is urgently needed, otherwise another “financial crisis” is imminent.”
As we discussed in that article, the “purveyors of doom” have been saying the same thing for the last two decades, yet the American growth engine continues chugging along. Notably, Ray Dalio and Larry Summers focus on only one solution: “cutting spending,” which has horrible economic consequences.
“Furthermore, investors must understand a critical accounting concept: that the government’s debt is the household’s asset. In accounting, for every debit there is a credit that must always equal zero. In this case, when the Government issues debt (a debit), it is sent into the economy for infrastructure, defense, social welfare, etc. That money is “credited” to the bank accounts of households and corporations. Therefore, when the deficit increases, that money winds up in economic activity, and vice versa. In other words, those shouting for sharp deficit reductions are also rooting for a deep economic recession.” – The Deficit Narrative
The other challenges with cutting spending are that it is politically toxic, and tax hikes drag on growth.
However, one solution that all the mainstream “doomsayers” overlook is raising productivity and GDP through private-sector capital investment. In other words, as the U.S. did following World War II, it is possible to “grow your way out of your debt problem.”
That’s where the AI data center boom and massive electricity demand come in.
Tweet of the Day
More By This Author:
Markets: Bullish Vs. Bearish CaseOverbought Conditions Across Multiple Markets
Data Centers And The Power Grid: A Path To Debt Relief?


Comments
Log in or sign up to join the conversation.