
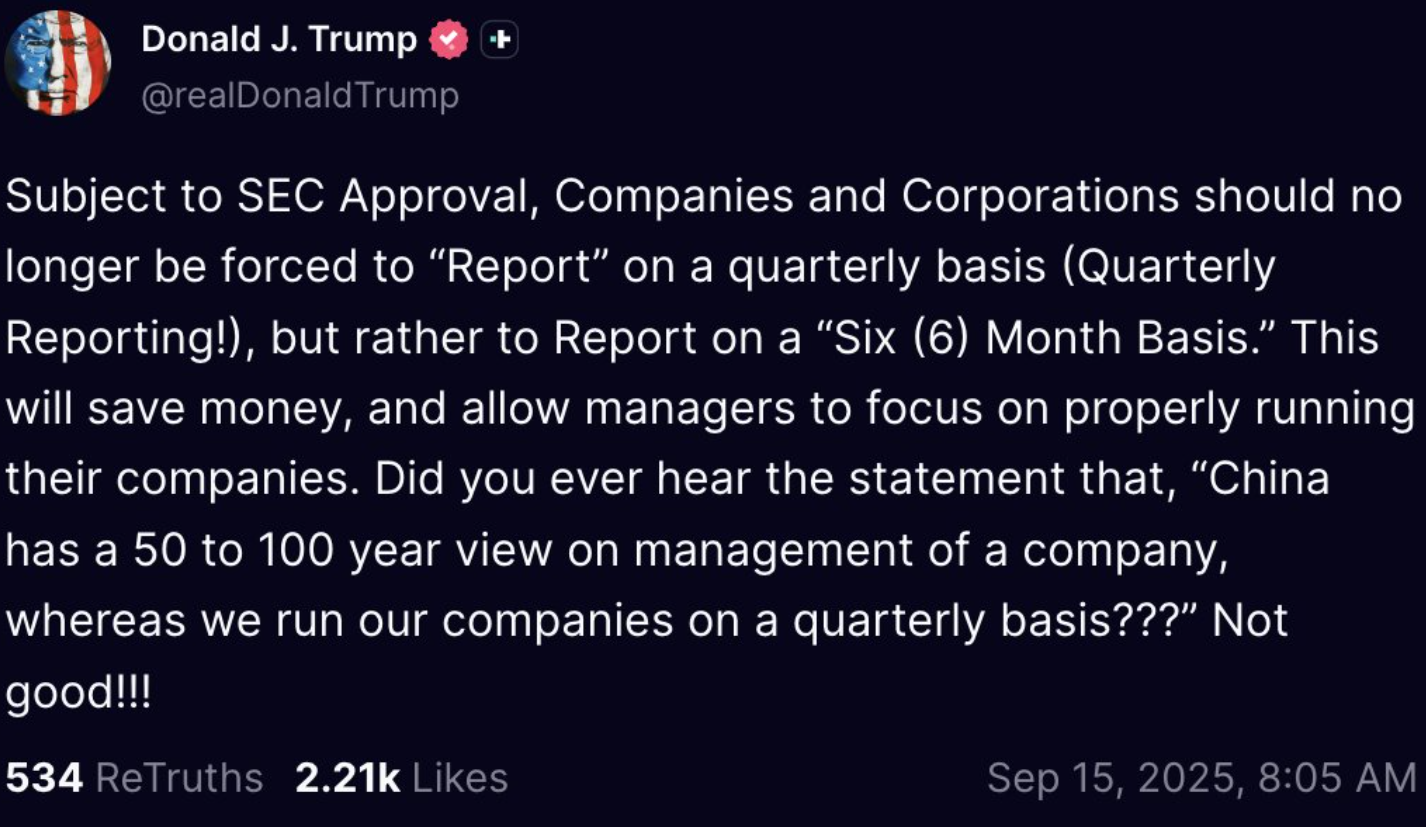
President Trump is pushing to reduce the SEC’s financial reporting requirements from quarterly to semiannual reporting. He’s framing the idea in a positive light: it would allow managers to focus on the business, lower compliance costs, and fight “short-termism” in markets. In reality, it would weaken one of the hallmarks of U.S. capital markets: timely and transparent disclosure. The SEC has required U.S.-listed companies to report results quarterly since 1970, a standard that has long supported investor confidence and efficient markets.
Quarterly reporting provides investors with regular insight into company performance, reducing uncertainty and lowering the cost of capital. Semiannual reporting would work against investors by increasing information gaps, raising the risk of surprises, and creating more room for insider advantage. Investors would be left with stale data, and when results finally arrive, the adjustment to new information could be sharper and more volatile. That dynamic would be especially evident in fast-moving industries like technology, where six months can radically alter a company’s outlook.
Ultimately, less frequent disclosure would not benefit investors. It would harm them. Fewer checkpoints may lead investors to demand a higher risk premium, effectively pushing equity valuations lower while raising the cost of capital for businesses. In the end, semiannual reporting requirements are more likely to undermine markets than strengthen them.
What To Watch Today
Earnings
(Click on image to enlarge)

Economy
(Click on image to enlarge)

Market Trading Update
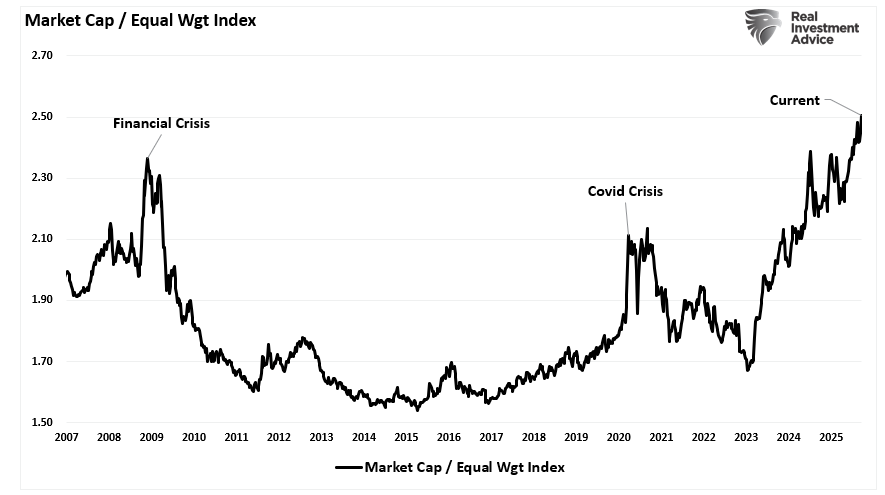
Yesterday, we discussed how the market is overbought on a longer-term basis. Such should not be surprising given the run since the late March and early April correction. However, as noted previously, that run has been predominantly concentrated in the largest market-capitalization names, as noted by the divergence between the equal-weighted and market-cap-weighted S&P 500 Index.
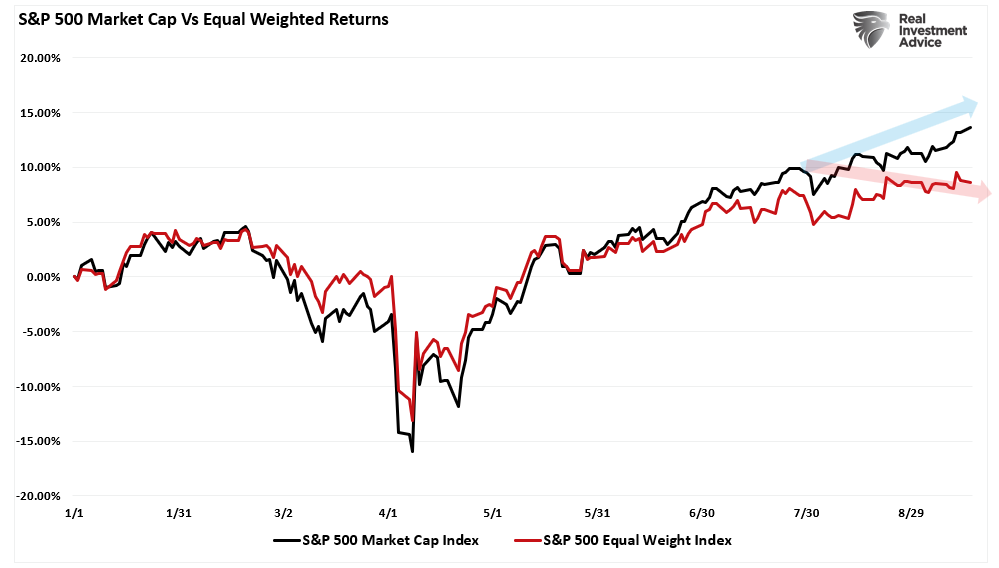
The performance spread between the two indices can help us visualize the breadth differential in the market better. While the current performance differential is noteworthy, it does not mean the market is set for a significant bear market, but it does argue for some caution.
Over the last five years, typically non-correlated assets have rallied together. The Nasdaq is up 129%, and the S&P is higher by 99%, followed by gold (89%), small caps (86%), gold miners (78%), international (66%), and emerging markets (32%). While it has been a good investing market for virtually any asset class you want to throw money at, it leaves investors vulnerable to a correction that could simultaneously impact every asset class.
(Click on image to enlarge)
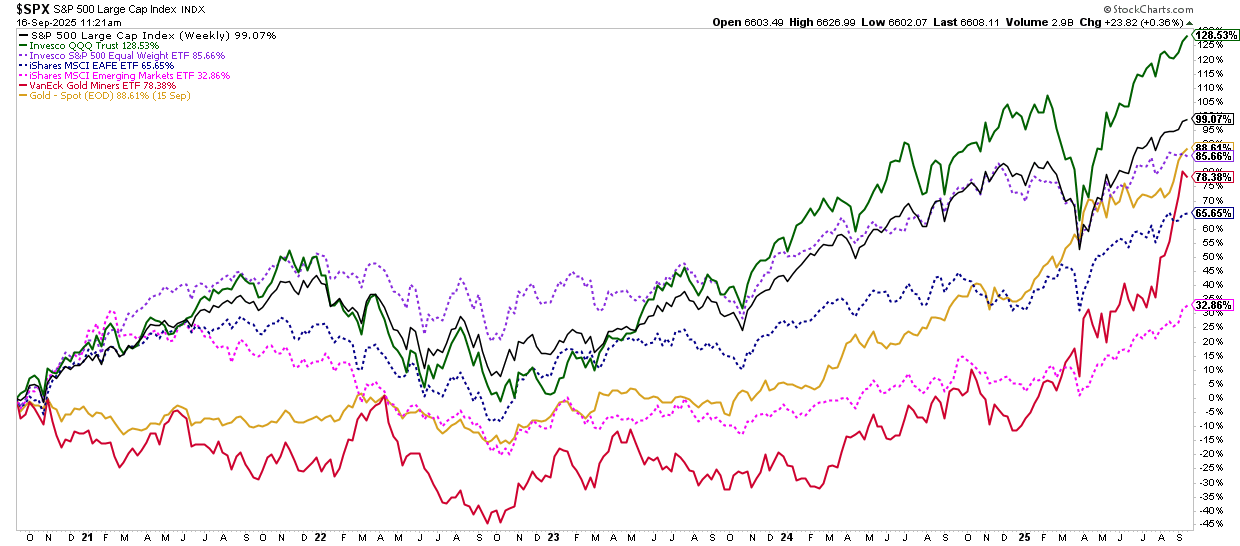
While the clear winner over the last 5 years has been to chase technology stocks, or stocks in general, the build-up of complacency and deviations from long-term means is a risk worth considering.
Narratives about why one asset class or another will continue to perform indefinitely are fine, except that they are extraordinarily wrong. Whatever asset you are heavily weighted into, pay attention to the technical backdrop and the previous periods in history where overbought conditions, deviations from the mean, and sentiment were similar. You will find that forward returns were not what the market was leading investors to believe.
August Retail Sales Blew Past Estimates
Retail sales rose 0.6% in August, outpacing the 0.2% consensus and matching July’s upwardly revised figure. Control group sales, which feed directly into GDP calculations, increased 0.7% in August versus estimates of 0.4%. August marks three consecutive months of growth, suggesting consumer spending remains resilient despite higher borrowing costs and softening labor data.
The details paint a picture of broad-based strength. As shown below, sales increased in 9 of the 13 categories. Online shopping contributed over half of the growth in August, with restaurants and auto sales also adding significantly.
For the Fed, the retail sales beat complicates the story. While the labor market has softened and producer prices fell last week, consumers continue to spend at a healthy pace. For now, August retail sales reinforce the case for a more gradual path of rate cuts heading into today’s FOMC meeting.

Portfolio Risk Management: Accepting The Hard Truth
Alfonoso Peccatiello recently wrote an interesting piece on portfolio risk management, starting with a quote from Steve Cohen:
‘’I compile statistics on my traders. My best trader makes money only 63 percent of the time. Most traders make money only in the 50 to 55 percent range. That means you’re going to be wrong a lot. If that’s the case, you better be sure your losses are as small as they can be, and that your winners are bigger.’’
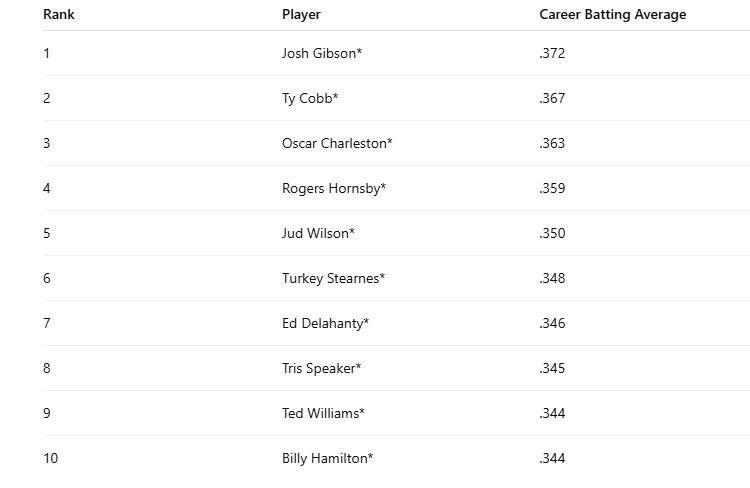
If you think that is a poor “batting average,” we can gain some perspective by looking at the top-10 highest batting averages in Major League Baseball. You should notice that the best baseball hitters in history only succeeded about 35% of the time they went to bat.
Tweet of the Day
More By This Author:
Trump’s BLS Reform Faces Steep Obstacles
Invest Or Index – Exploring 5-Different Strategies
Overnight Funding Costs Signal Liquidity Strain


Comments
Log in or sign up to join the conversation.