
Positive Divergence Going Forward

Image Source: Pexels
SPX Monitoring purposes; Long SPX 4/12/24 at 5123.41.
Our Gain 1/1/23 to 12/31/23 SPX= 28.12%; SPX gain 23.38%
Monitoring purposes GOLD: Long GDX on 10/9/20 at 40.78.
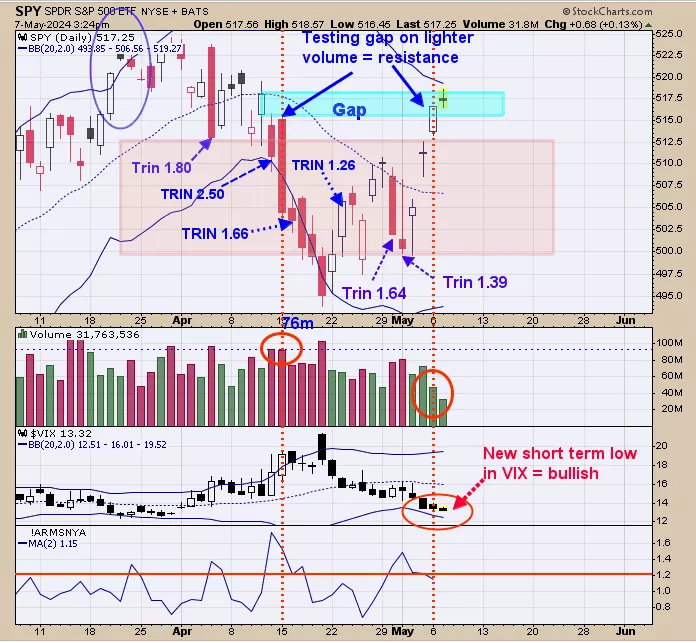
Closes above 1.20 on the TRIN show panic is present in the market and panic form near lows. We shaded in light pink the times where TRIN closes exceeded 1.20 and that area appeared from the 500 to 512 SPY range suggesting this area is a support area. We shaded in light blue where a gap lies. If a gap is tested on lighter volume than the gap has resistance and yesterday and today the gap was tested on lighter volume. What this suggests is that SPY may see a mild consolidation before heading higher. The second window up from the bottom is the VIX. The VIX can predict a pullback in the SPX by moving higher as the SPX is moving higher and so far that hasn’t happened as the SPX was modestly higher and the VIX was modestly lower which in turn lean bullish for the short term. Pull back or no pull back for the short term the bigger trend remains up. The April consolidation is over and a new uptrend has started.
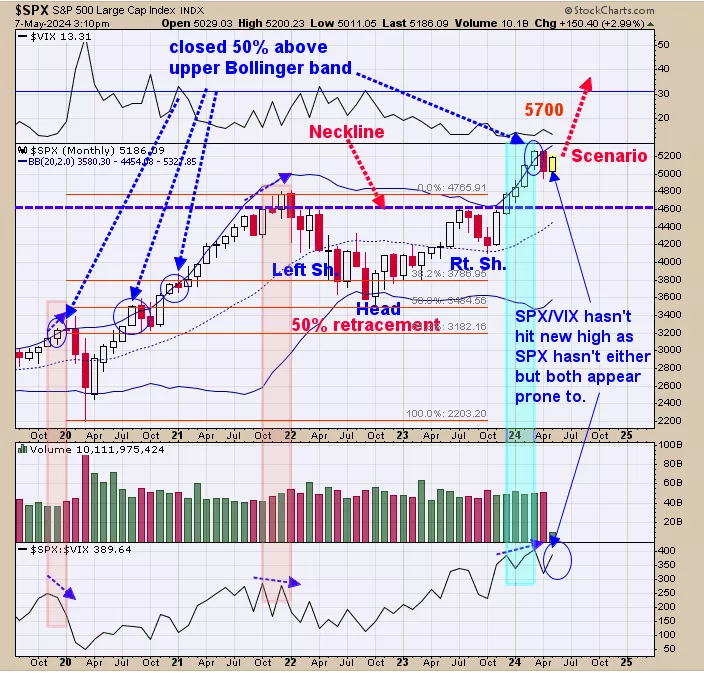
The bottom window is the monthly SPX/VIX ratio and the middle window is the monthly SPX. Divergence occurs when the SPX makes higher highs and the SPX/VIX ratio makes lower high and this divergence is a bearish sign (noted in light pink). The last go around showed that the SPX made higher highs along with the SPX/VIX ratio suggesting the larger trend is up (noted in shaded light green) (though there was a pullback in April). SPX/VIX ratio hasn’t hit a new high as the SPX hasn’t either but both appear prone to do so. Both have rallied the last couple of weeks and VIX looks closer to hitting a new high and if it does before the SPX will produce a positive divergence going forward. A bigger trend appears bullish.
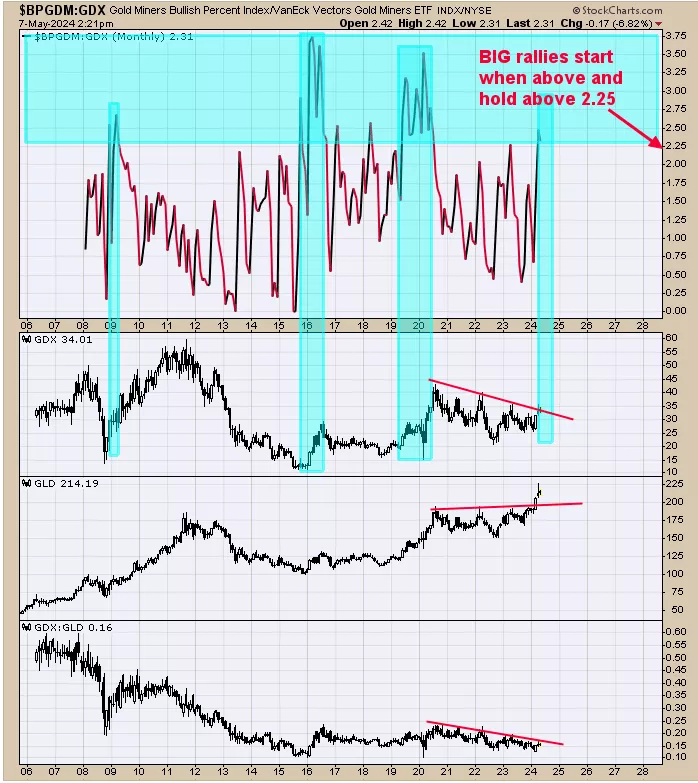
The top window is the monthly “Bullish Percent index for Gold Miners index/GDX ratio”.What we observed is that when this ratio is above 2.25 (current reading is 2.31) and holds above 2.25, big rallies start in GDX. We shaded in light green the times this ratio was above 2.25 and ran that shaded area down to the GDX chart directly below. This ratio has been above 2.25 the last couple of months and appears to be holding. We have other shorter-term indicators (see last night’s report) that suggests the current rally has further to go. The current timeframe is starting to mirror the 2016 and 2019 timeframe (shaded light green).
More By This Author:
New Highs Are Likely
Bigger Trend Is Still Up For The Market
Bigger Trend Remains Up
Signals are provided as general information only and are not investment recommendations. You are responsible for your own investment decisions. Past performance does not guarantee future performance. ...
more

