
Bigger Trend Remains Up

Image Source: Pexels
SPX Monitoring purposes; Long SPX 4/12/24 at 5123.41.
Our Gain 1/1/23 to 12/31/23 SPX= 28.12%; SPX gain 23.38%
Monitoring purposes GOLD: Long GDX on 10/9/20 at 40.78.
(Click on image to enlarge)
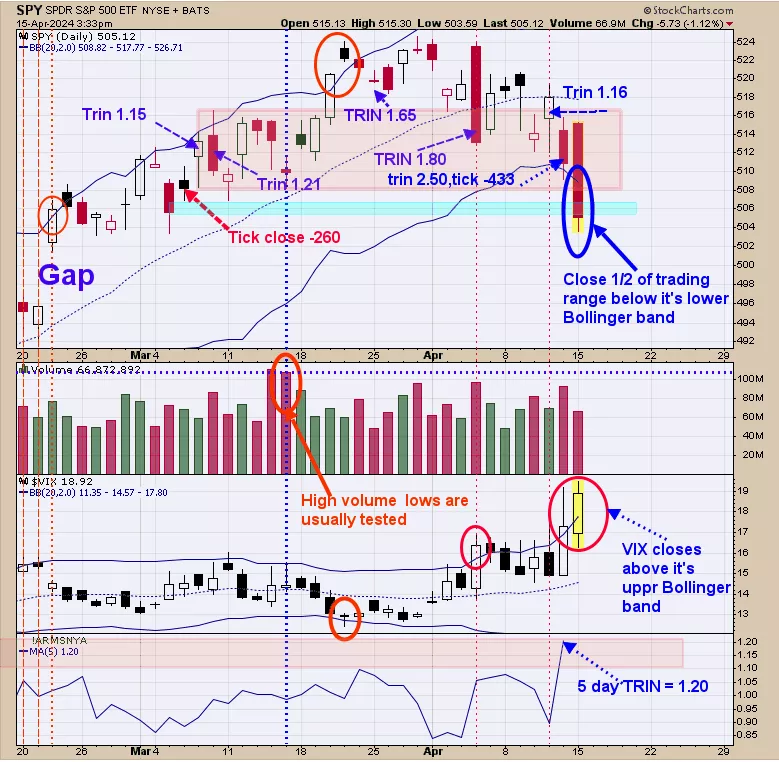
We highlighted in light pink the area on the SPY where the TRIN closes reached near the 1.20 range and higher. This highlighted area represents a support area. Friday the TRIN closed at 2.50 and the Tick closed at -433 which is a bullish combination suggesting a low will form as early as the day of the readings to as late as two days later which would be tomorrow. The 5-day TRIN (bottom window) has reached the bullish level near 1.20 (current reading is 1.20). Today the VIX closed above its upper Bollinger band and the SPY closed below its lower Bollinger band showing short-term exhaustion. The bigger trend remains up and the short-term trend appears to be bottoming.
(Click on image to enlarge)
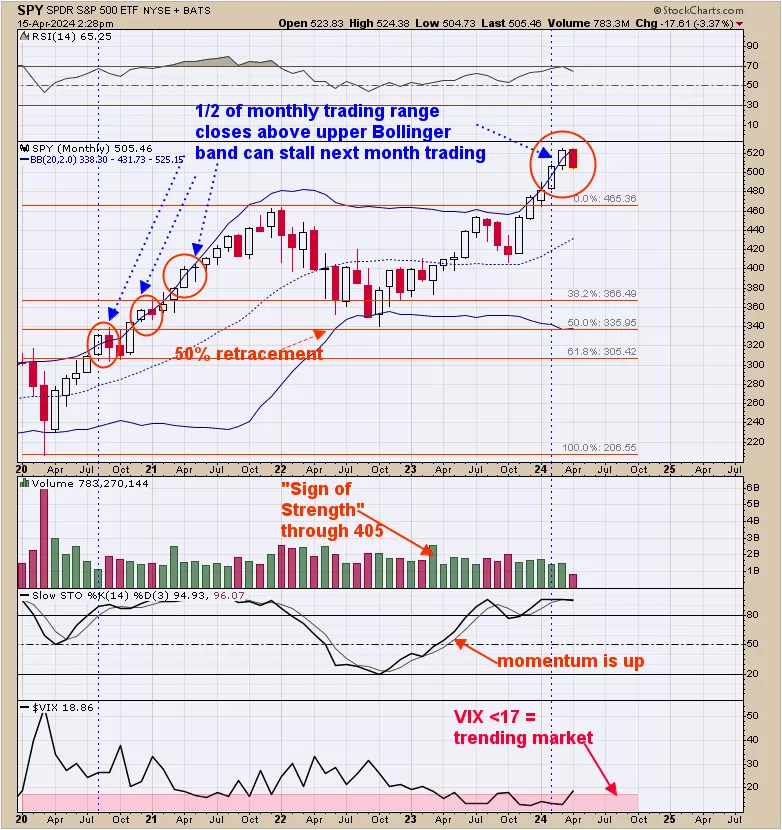
We updated this chart from last Thursday. Last Thursday's commentary still stands, we said, “Above is the monthly SPY with its Bollinger band. When the monthly SPY closes half of its trading range above its upper Bollinger band the following trading month can see a consolidation or at least stalls the market. Notice that the month of March, half of its trading range closed above its upper Bollinger band and so far April has stalled. We are in a “Time out” in an up-trending market.”Current pull back may be near an end.
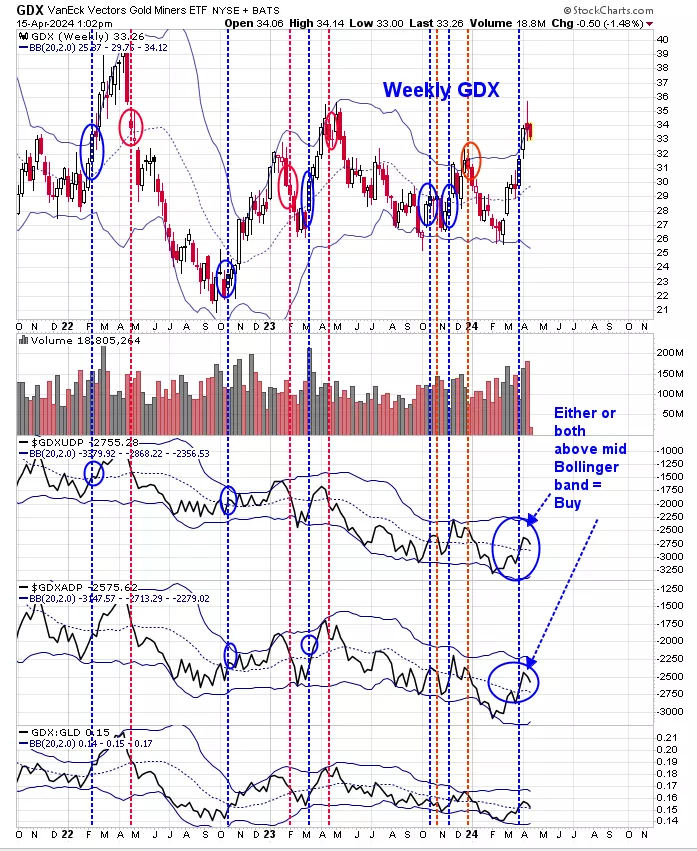
Last Thursday we looked at the daily GDX/GLD ratio; the GDX Advance/Decline; and the GDX Up down volume and all were above their mid Bollinger bands showing the daily uptrend was intact. The above chart is the same indicators but on a weekly timeframe. The bottom window is the weekly GDX/GLD ratio; next higher window is the weekly GDX Advance/Decline and the next higher window is the weekly GDX up-down volume indicator. All three indicators gave a buy signal in late March by closing above their mid-Bollinger bands (noted with dotted blue lines; sell signals noted in red dotted lines). The weekly indicators can sometimes be whippy but signals in general last several months. Later this week we will look at the monthly chart for these indicators which carry the most importance. Don’t see any short-term high here other than a mild consolidation. A potential large move in gold may have started.
More By This Author:
SPY Could Pull Back
All About The S&P
S&P 500 Remains Bullish
Signals are provided as general information only and are not investment recommendations. You are responsible for your own investment decisions. Past performance does not guarantee future performance. ...
more

