
New Highs Are Likely

Image Source: Pexels
PX Monitoring purposes; Long SPX 4/12/24 at 5123.41.
Our Gain 1/1/23 to 12/31/23 SPX= 28.12%; SPX gain 23.38%
Monitoring purposes GOLD: Long GDX on 10/9/20 at 40.78.
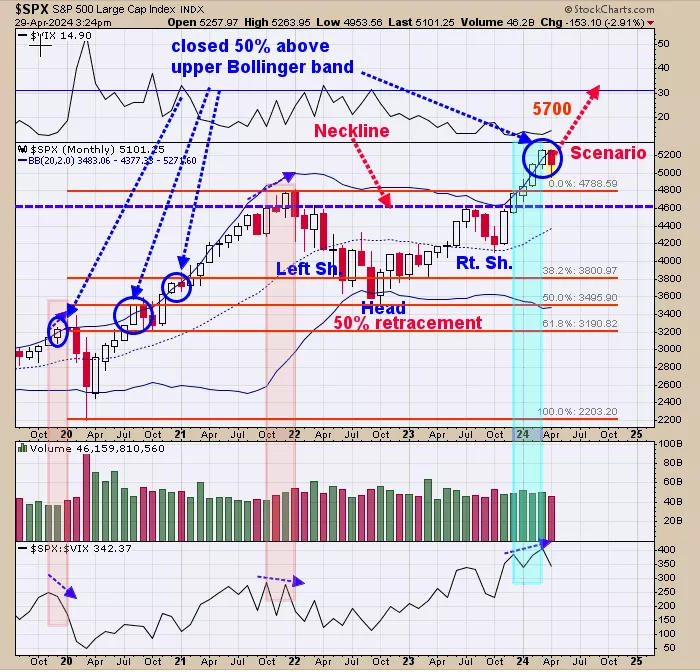
Above is the monthly SPX with it monthly Bollinger band. The month of March closed 50% of its trading range above the upper Bollinger band (circle in blue) suggesting April could see a consolidation (which it did). The bottom window is the monthly SPX/VIX ratio. Intermediate-term highs form when this ratio makes lower highs as the SPX made higher highs (Noted with shaded pink). Currently, the SPX has made higher highs and the SPX/VIX ratio also has made higher highs showing no negative divergence and the bigger trend is up. The Head and Shoulders pattern noted on the chart above has a measured target ear 5700 which is near 12% higher than current levels. Bigger trend remains up and new highs in the SPX are likely.
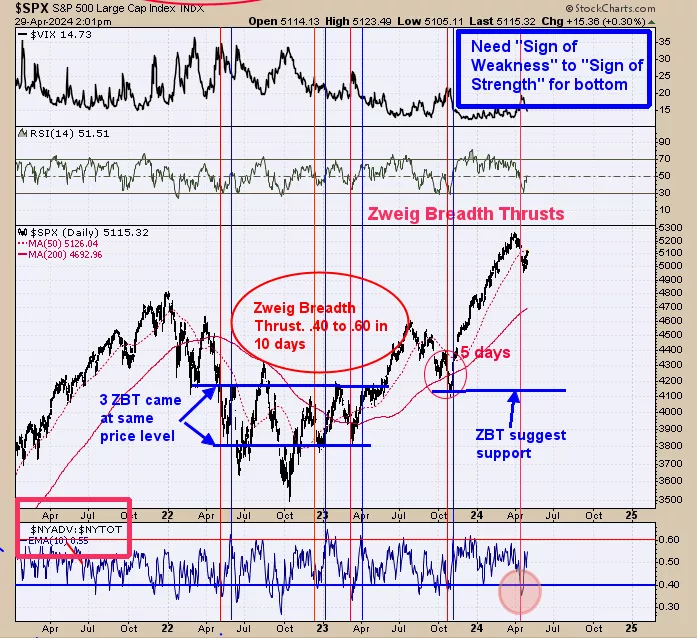
We are keeping a close eye on this indicators as it has a positive effect on the bigger trend if it “kicks in”, last Monday we said, “Not sure if this chart will “kick in” but if it does would be a bullish sign. Above is the Zweig Breath Thrust indicator (ZBT); bottom window. The ZBT is triggered when the NYSE Advance/NYSE total with a 10-day moving average falls below .40 and then rallies to .60 in ten days or less. It’s a bullish sign for the market going forward.ZBT has turned up from below .40 on April 18 and now stands at +.50.It would need to reach .60 on May 1 (next Wednesday) or before. Evidence suggests the bigger trend is still up for the market and another 10% or more is possible before yearend”. Today the ZBT closed at .55 and has two more trading day’s to get to .60 or higher. A ZBT of .60 by Wednesday will suggest the rally phase that began last October is still in force and new highs in the market are likely.

The bottom window is the 50-day average of the Up-down volume for GDX. This is a momentum indicator an is designed to catch the trend of the market and not the highs and lows. As long as the 50-day average of the up down volume remains above “0” the trend of GDX is considered to be up (noted in light blue on chart above). The current reading is +13.09 and appears to be still rising suggesting GDX is gaining strength. The top window is GDX and we drew a dotted red line and prices are at that dotted line now. Ideally, we would like to see a “sign of strength” (SOS) through this line in the coming day to “prove” a breakout above this line. With the 50-day average of the Up down volume gaining strength, it suggests and SOS may be coming.
More By This Author:
Bigger Trend Is Still Up For The MarketBigger Trend Remains Up
SPY Could Pull Back
Signals are provided as general information only and are not investment recommendations. You are responsible for your own investment decisions. Past performance does not guarantee future performance. ...
more

