
PayPal Stock May Have Finally Found The Bottom (Technical Analysis)

Image Source: Pexels
PayPal (Nasdaq: PYPL) finally appears to be bottoming out from a technical perspective. This is supported by the stock's attractive valuation and strong expected growth for 2024. The overall outlook for 2024 is positive for the company.
First, I wanted to address some recent news that could be of concern to investors. The announcement that Amazon (AMZN) will no longer accept Venmo for payments is not really a significant negative blow for PayPal. The reason for that is because credit cards are the most used method of payment on Amazon. Amazon will still accept Venmo credit and debit cards. Amazon is just discontinuing the use of the Venmo instant payment option. So, the decision shouldn't have a material negative impact on PayPal. PayPal has better growth avenues, which I will explain.
With that said, let's get into the analysis:
PayPal's Monthly Chart
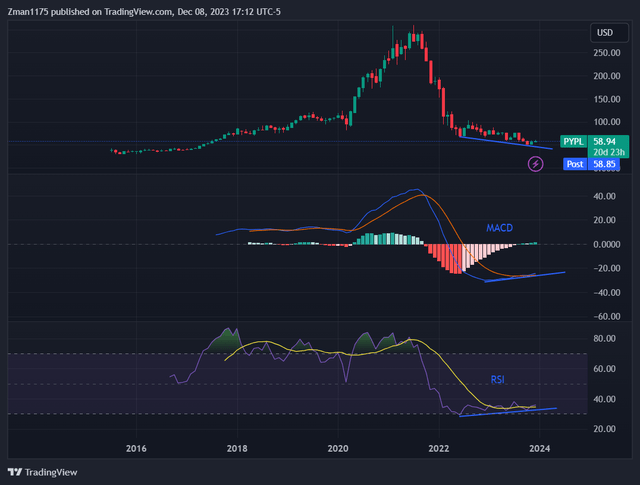
PayPal (PYPL) Stock Chart w/ MACD & RSI (tradingview.com)
The main set-up that is noticeable on the monthly chart is the bullish divergence between the recent declining stock price and the rising trend on the MACD and RSI indicators from 2022 through 2023. This set-up typically results in a stock price reversal. Since this is on the monthly chart, the reversal is likely to last for the long term (for at least a year).
The reason why I say it could last a year is because the last large rally lasted from April 2020 to July 2021 as a technical point of reference. Another reason is the company's growth is expected to be strong in 2024. PayPal's stock can drive higher in 2024 since it is supported by strong expected revenue and earnings growth. Revenue is expected to grow by 8% to 9% while earnings are expected to grow by 12% to 13% in 2024.
The MACD indicator recently shifted from bearish to bullish as the blue MACD line crossed above the red signal line and the histogram turned green. The RSI indicator increased from an oversold condition in 2022 and crossed above its yellow moving average, which confirms a bullish change in trend. There is also long-term price support around this $50 level, where the stock began to rally back in 2017.
The bullish divergence and the bullish indications on the MACD and RSI indicate that a bottom is likely in for the stock.
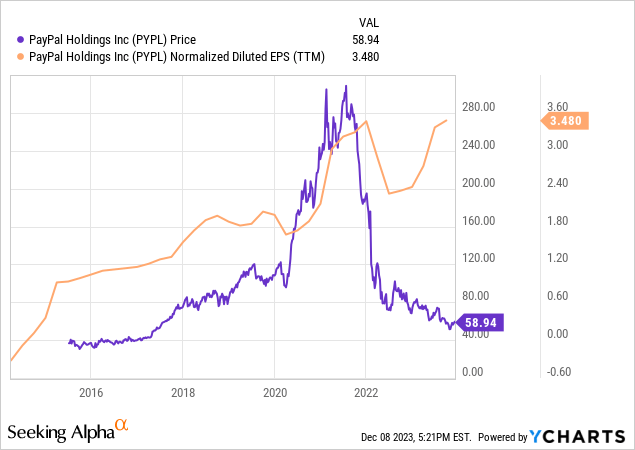
Data by YCharts
Continue reading at Seeking Alpha.
More By This Author:
Bitcoin: Multiple Time Frame Price Analysis (Technical Analysis)
Block: Stock Is Set Up For A Large Move (Technical Analysis)
Heritage Insurance Is My Best Value Idea
Disclosure: I/we have no stock, option or similar derivative position in any of the companies mentioned, and no plans to initiate any such positions within the next 72 hours.
Disclaimer: The ...
more

