Near Perfect Ratings And Upward Trend Channel Are Good News For Abbott Labs
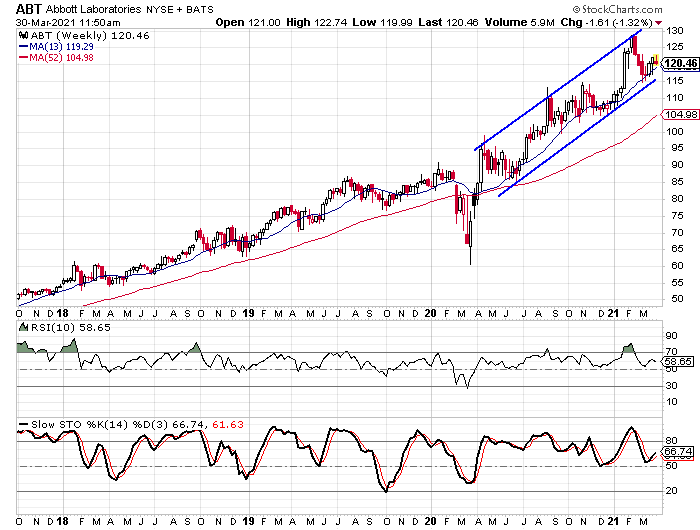
Pouring over charts this past weekend, I was struck by the weekly chart of Abbott Laboratories (ABT). Over the last 12 months, a rather tight upwardly-sloped channel has formed and the stock is near the lower rail currently. We will look at the chart later because I was even more impressed when I looked at the fundamental ratings for the stock.
When I looked at the fundamental screener from Tickeron, Abbott scored well in five different categories and didn’t have any negative ratings. Two areas where the company did extremely well were the Valuation rating and the Profit vs. Risk rating. The three other ratings that were positive were the Outlook rating, the Price Growth rating, and the Seasonality Score.
Breaking down the valuation rating, the stock is trading with a trailing P/E of 33.5 and a forward P/E of 24.2. The trailing PEG ratio is at 2.35 and forward PEG ratio is 1.48. The forward PEG is considerably lower than the industry average.
The profit vs. risk rating is based on the balance between profit, volatility, and drawdown. Given the tight upward trend I mentioned earlier and the profitability measurements for the company, I can’t say I’m surprised that Abbott scored well in this category. The return on equity is 20.5% and the profit margin is 22.3%. Both of those indicators are well above the industry averages.
(Click on image to enlarge)

Looking at other fundamental indicators, Abbott has seen solid earnings and revenue growth over the last few years, but that growth has really accelerated in recent quarters. The average annual EPS growth rate for the last three years is 10%, but the most recent quarter saw earnings jump 53%.
Revenue has grown at a rate of 6% per year over the last three years and it jumped 29% in the fourth quarter of 2020. Analysts expect revenue to grow by 38.8% in the first quarter of 2021 and by 22.1% for 2021 as a whole. Earnings are expected to grow by 95.4% in the first quarter and by 38.4% for the year.
Less than a $20 Spread Between the Top Rail and the Lower Rail
I mentioned already that Abbott has been moving higher within a trend channel. The channel started at the beginning of last April and it defines the various cycles within the overall upward trend. One of the things that impressed me most about the channel was how tight the channel is. It is approximately $18.70 from the lower rail up to the upper rail.
(Click on image to enlarge)

We see how the stock hit the lower rail in June of last year and again in December and January. The lower rail is currently just above the $115 level. The upper rail connects the closing highs from last April, August, and in February of this year.
The overbought/oversold indicators were in overbought territory back in February and they dropped as the stock went through a three week losing streak at the end of the month. The 10-week RSI dropped down to around 55 and has since turned slightly higher. The weekly stochastic indicators dropped to around the same level and have since made a bullish crossover.
Looking at the moving averages we see that the stock is hovering just above its 13-week moving average and the 13-week is $14.31 above the 52-week moving average. The trend higher for Abbott has been so consistent that the 13-week has been above the 52-week since February of 2017. The two almost made a bearish crossover last spring, but they never quite got there.
Bullish Sentiment Seems Warranted
Looking at the sentiment toward Abbott, the overall picture seems to show quite a bit of optimism, but that seems to be warranted. There are 22 analysts covering the stock at this time and 18 have it rated as a “buy”. There are two “hold” ratings and two “sell” ratings. As a percentage of the total, the buy percentage is 81.8% and that is higher than the average stock. The buy percentage for most stocks is in the 65% to 75% range.
The short interest ratio on Abbott is 2.5 and that’s a little below average. Even though the ratio is lower than the average stock’s, the short interest did jump sharply from mid-February through the mid-March reading. The number of shares sold short went from 10.5 million to 12.7 million. Seeing the short interest increase by over 20% in a month is a sign that there is some sense of bearish sentiment.
When I view the sentiment indicators, I prefer to see some sense of bearishness from investors. From a contrarian view, investors or analysts that are bearish can reverse their opinion on the stock and help push it higher. If everyone is already bullish, it leaves more room for them to reverse to a bearish position and push the stock down.
Ideally, you find extreme pessimism on stocks that you’re bullish on and heavy optimism on stocks you are bearish on. In the case of Abbott, neither the analysts’ ratings nor the short-interest ratio are extremely optimistic, and even if they were, the bullish sentiment seems warranted based on the strong fundamentals and the upward trend on the chart.
Given the overall picture for Abbott, I can see the stock moving up to the $160 level within the next six to nine months. The company has seen strong earnings and revenue growth and its profitability measurements are solid. The pattern on the chart shows an upward trend and the little dip in February brought the stock down to support. The sentiment isn’t a big driver behind the bullish posture, but it also isn’t a negative.
Disclaimer: Although our services incorporate historical financial information, past financial performance is not a guarantee or indicator of future results. Moreover, although we believe the ...
more


