

Image Source: Unsplash
Watch the free-preview video below extracted from the WLGC session before the market opens on 9 Jul 2024 to find out the following:
- Short-term and long-term support and resistance levels to watch in the S&P 500.
- How to interpret the low volume during a flag breakout.
- The potential target price for the S&P 500
- How to identify selling into strength in the uptrend.
- And a lot more…
Video Length: 00:03:19
Market Environment
The bullish vs. bearish setup is 376 to 195 from the screenshot of my stock screener below.
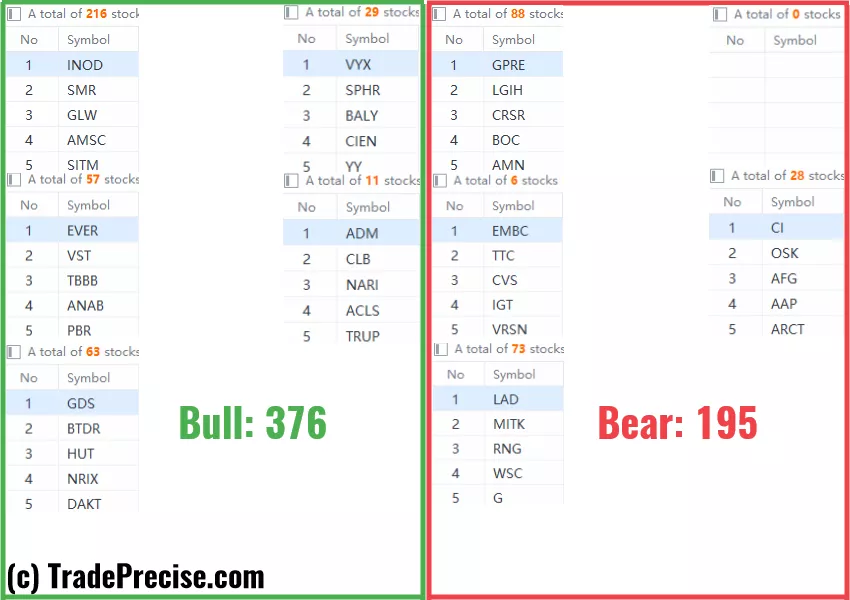
The market environment has been improving slightly.
However, the short-term market breadth is still consolidating and only a handful of the setups showing strong momentum.
3 Stocks Ready To Soar
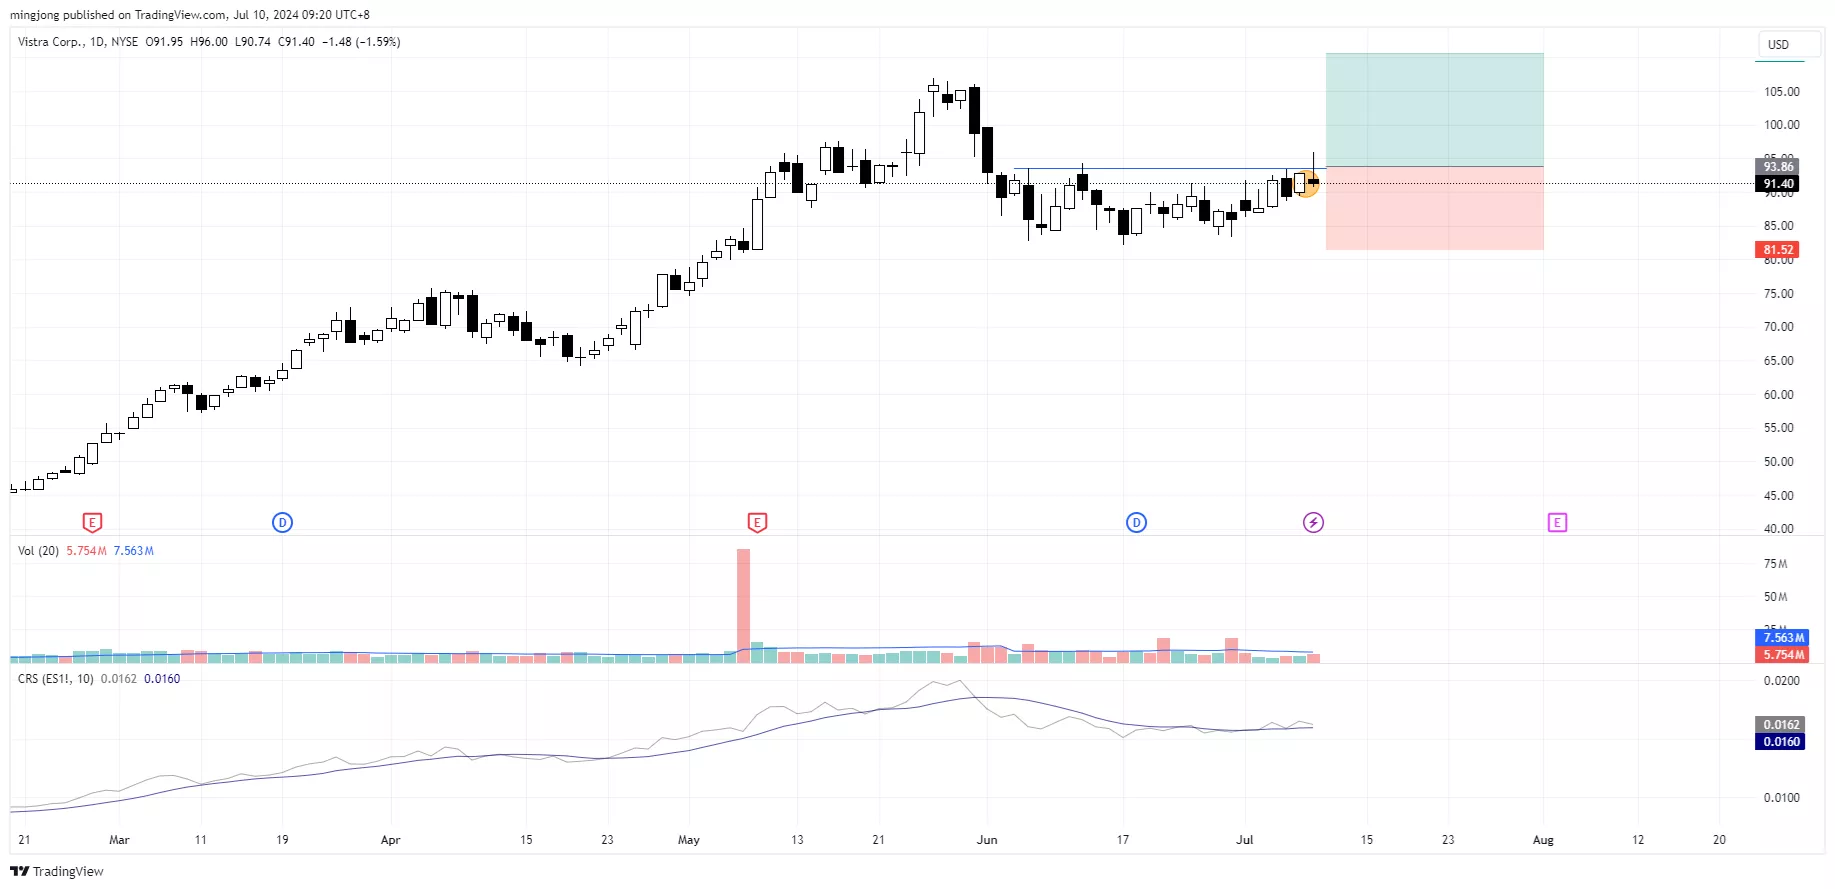
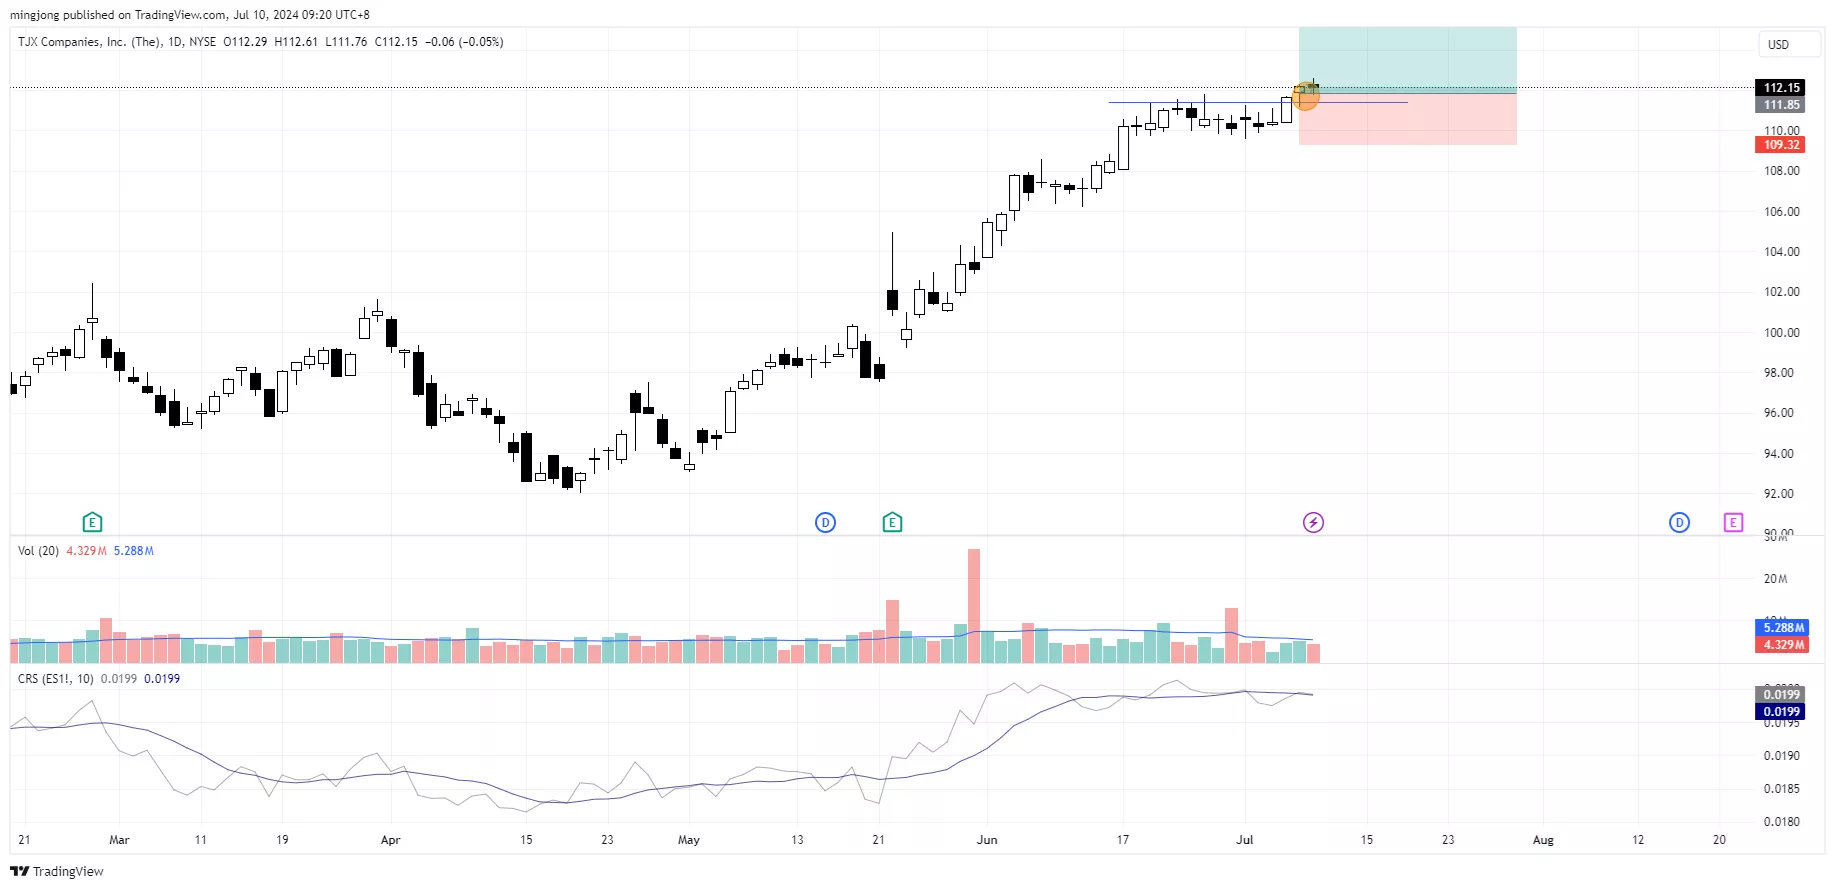
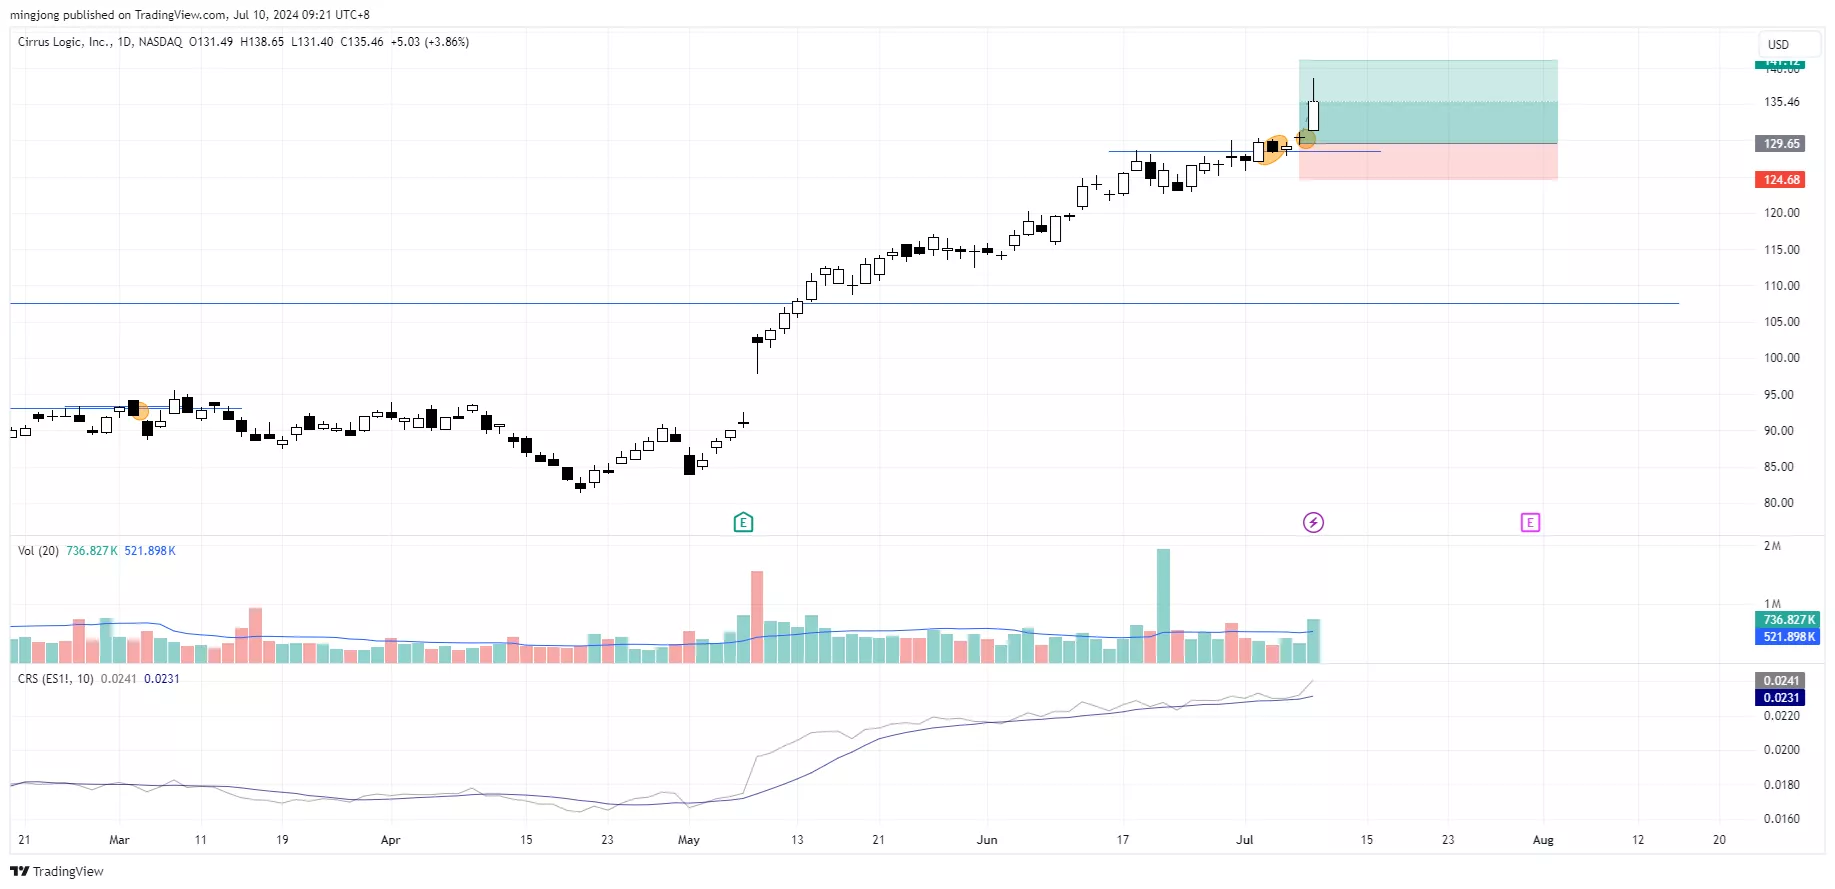
10 “low-hanging fruits” trade entries setups VST, TJX + 25 actionable setups CRUS were discussed during the live session before the market open (BMO).
(Click on image to enlarge)
(Click on image to enlarge)
(Click on image to enlarge)
More By This Author:
Could This Be The Turning Point? The S&P 500's Next Big Move Explained
Nasdaq 100 Overbought? Here’s What History Says About The Current Rally
Market Breadth Divergence: Bullish Or Bearish?


Comments
Log in or sign up to join the conversation.