
Market Breadth Divergence: Bullish Or Bearish?
Watch the free-preview video below extracted from the WLGC session before the market opens on 18 Jun 2024 to find out the following:
-
What does the divergence between the S&P 500's and market breadth's indicate for traders?
-
How significant is the oversold level in predicting a market rebound, and what thresholds should investors watch for?
-
The 2 scenarios you need to prepare for and my current bias based on 2 reasons.
-
And a lot more...
Video Length: 00:04:18
Market Environment
The bullish vs. bearish setup is 226 to 278 from the screenshot of my stock screener below.
(Click on image to enlarge)
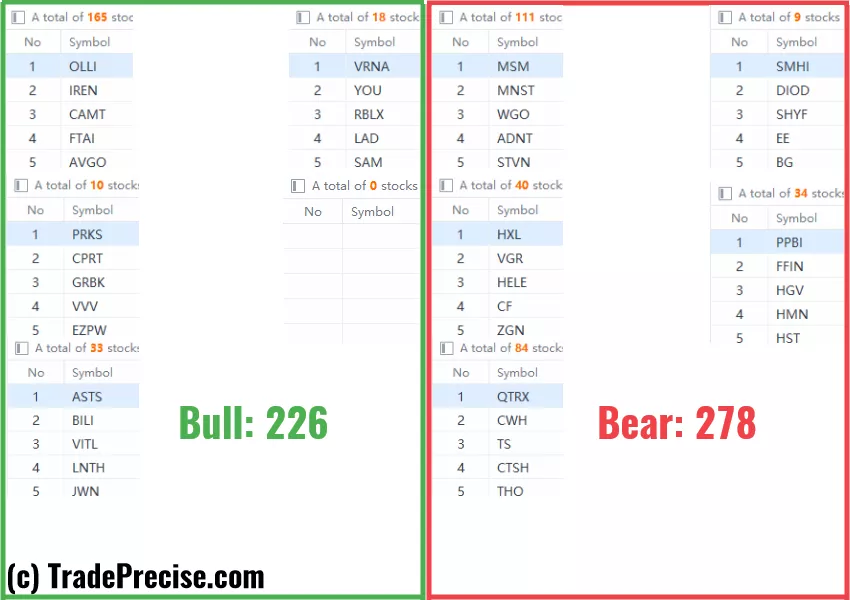
Although the market breadth has been decreasing, the number of bullish setups is still above 200. There is no shortage of the long setups.
However, the main focus should be on the technology stocks as this is the only sector RSPT beating the S&P 500.
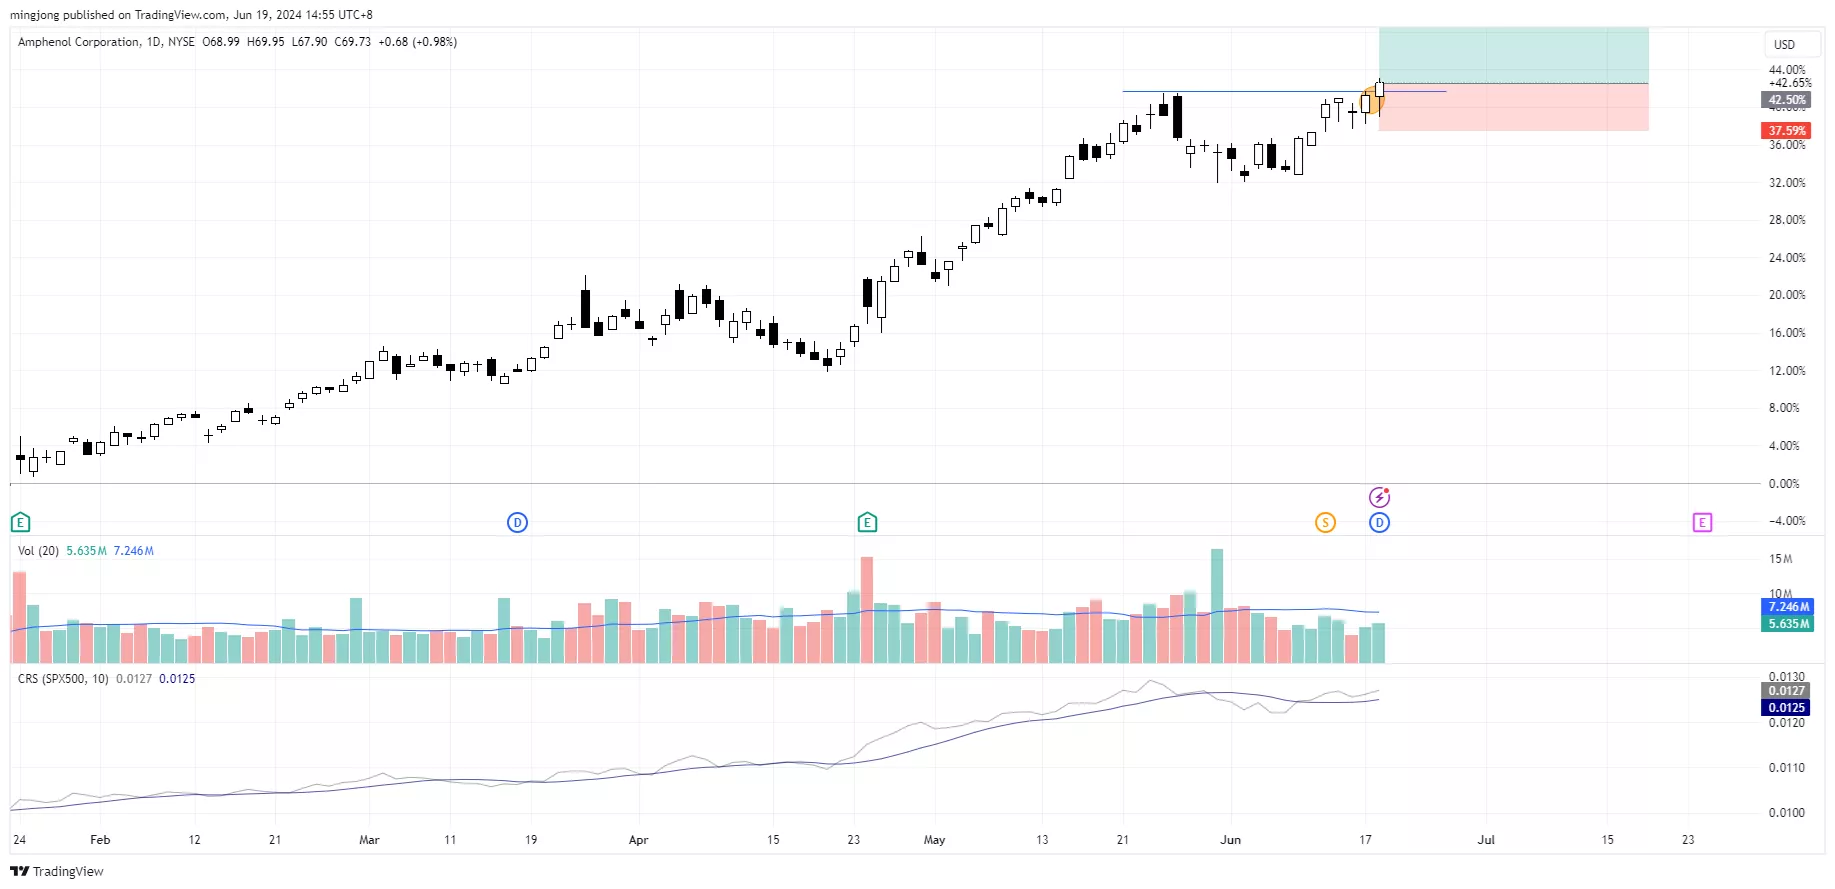
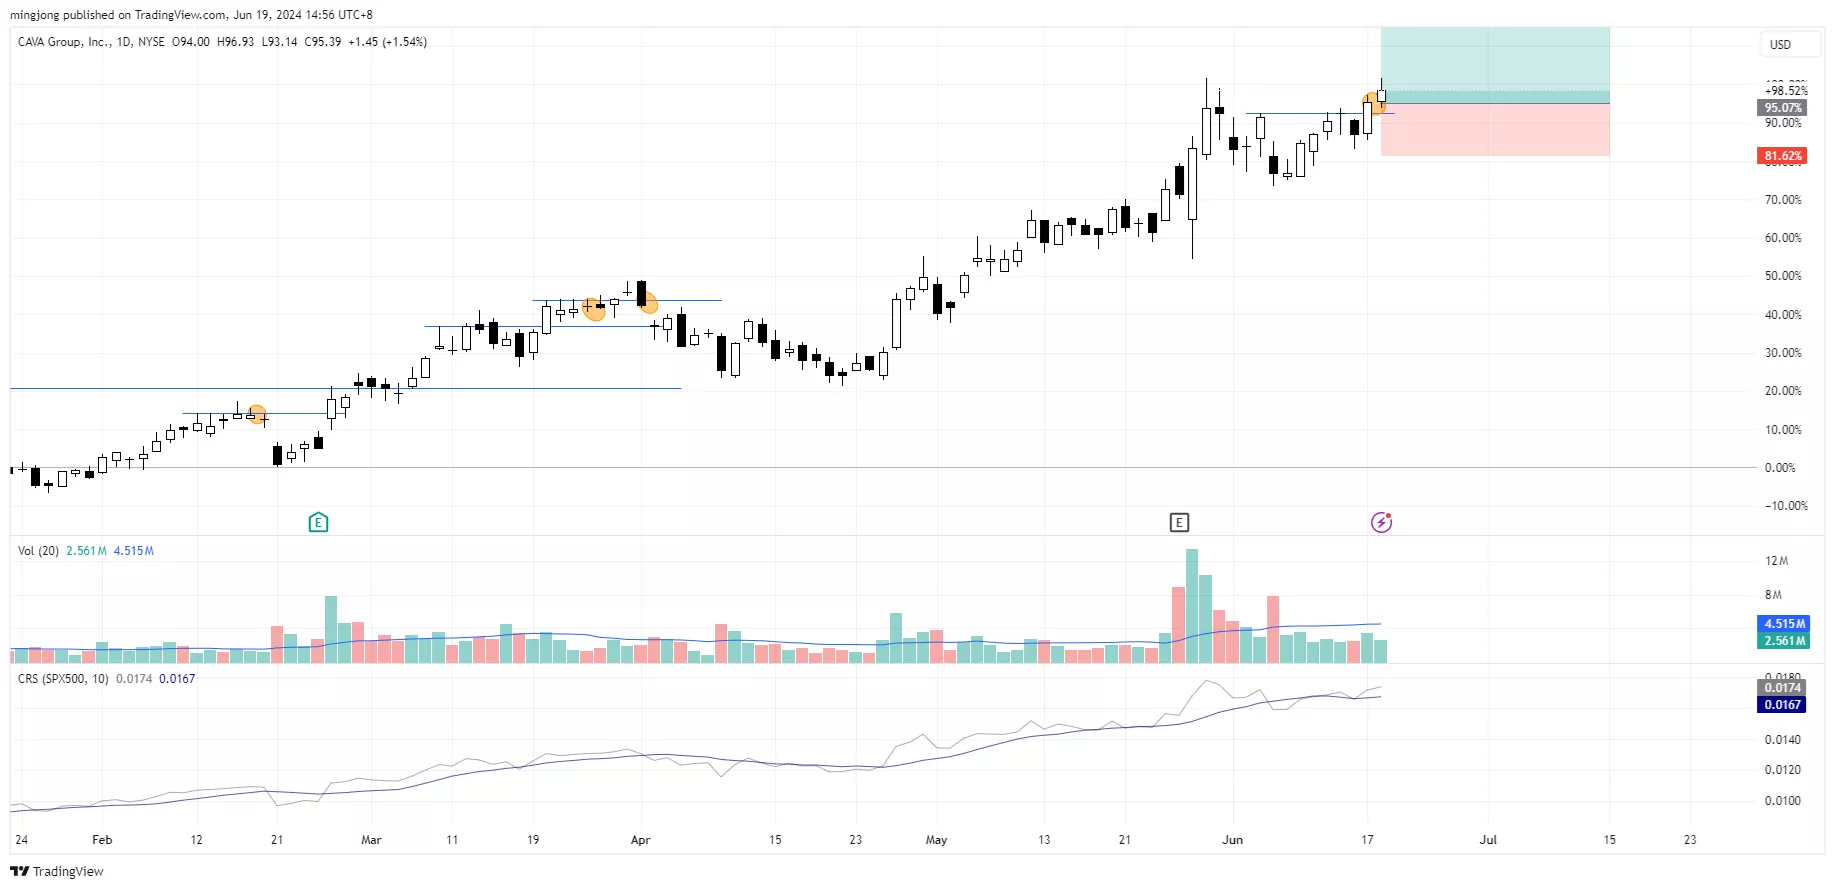
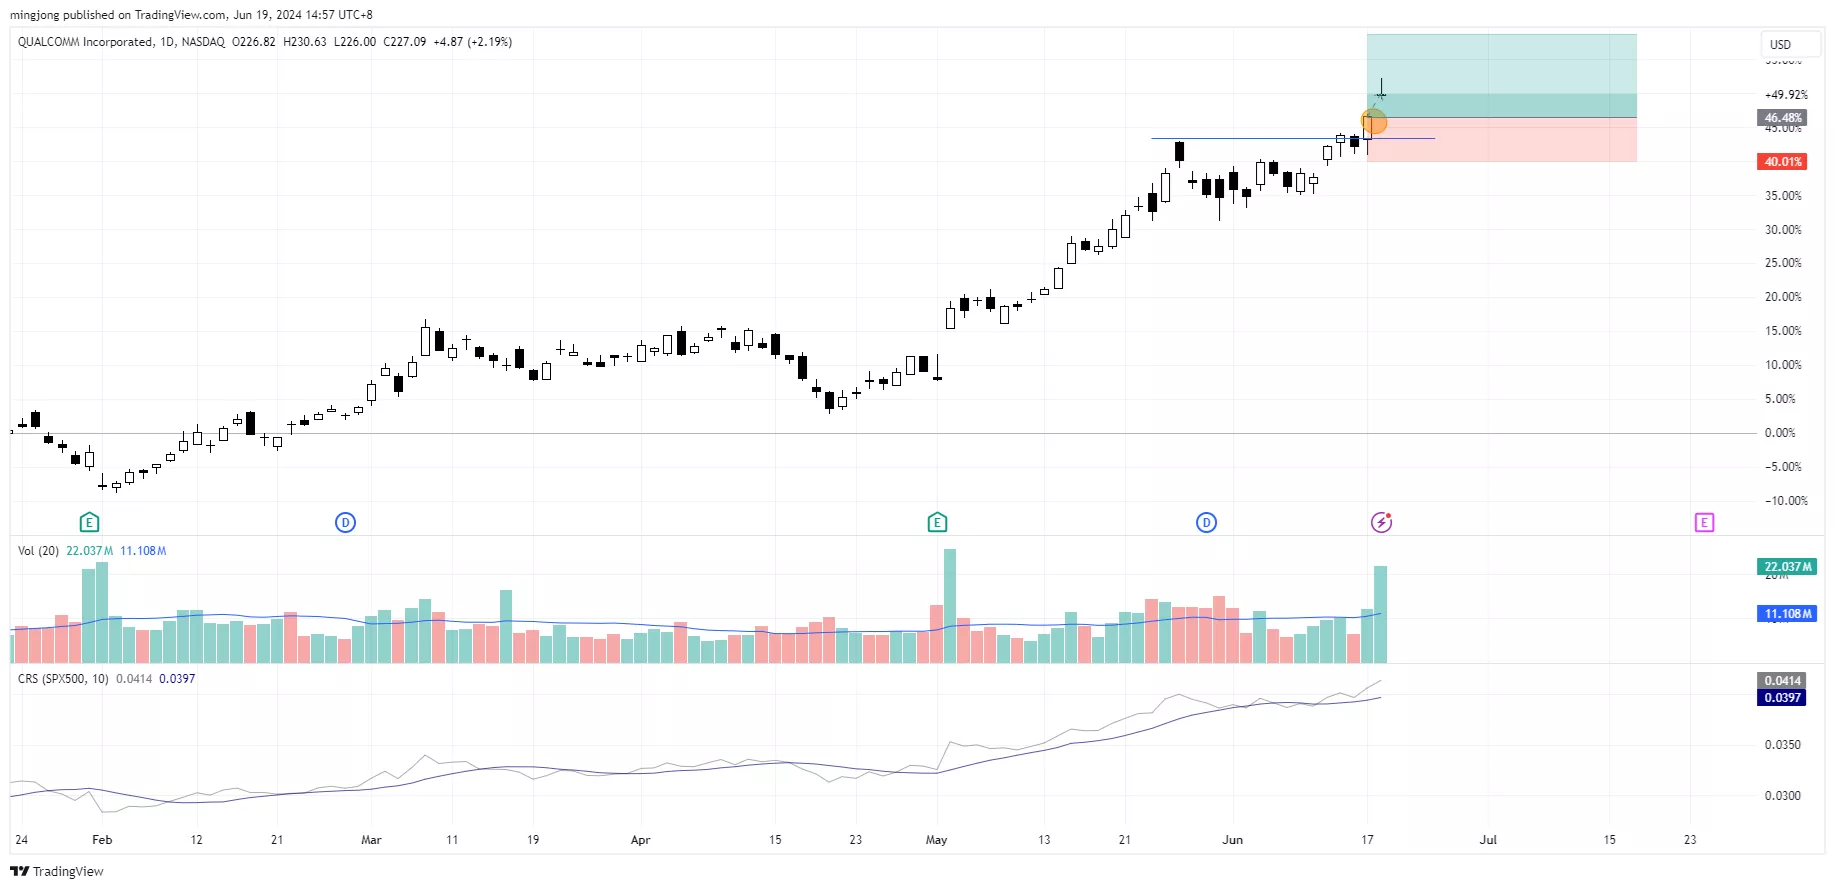
3 Stocks Ready To Soar
10 “low-hanging fruits” APH, CAVA, QCOM trade entries setups + 17 actionable setups were discussed during the live session before the market open (BMO).
The trade setup in DELL and MU discussed in the past session has been working well, further confirming the outperformance in the technology sector (apart from NVDA alone).
(Click on image to enlarge)
(Click on image to enlarge)
(Click on image to enlarge)
More By This Author:
Is The S&P 500 Ready For A Breakout?
Is This Bullish Reversal Signal The Key To Huge Gains Ahead?
Bearish Signal Spotted At Key Resistance Level!
Disclaimer: The information in this presentation is solely for educational purpose and should not be taken as investment advice.


