

Image Source: Unsplash
Watch the free-preview video below extracted from the WLGC session before the market opens on 3 Jul 2024 to find out the following:
- The significance of shallow consolidations in the S&P 500 and what it indicates about market direction
- How to read volume trends and identify selling into strength, and their implications for future market moves.
- Key support levels for the S&P 500 and how they serve as indicators for potential bullish or bearish market behavior.
- The signals indicate whether the market is likely to break out or pull back in the near future
- And a lot more...
Video Length: 00:04:31
Market Environment
The bullish vs. bearish setup is 364 to 236 from the screenshot of my stock screener below.
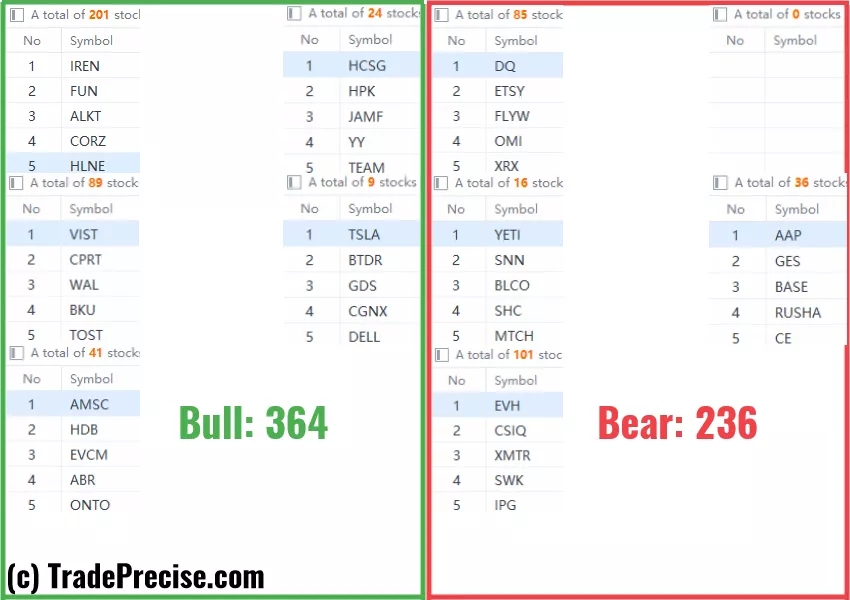
Although the short-term market breadth is still negative, there are still no shortage of the bullish setups.
The analogue comparison discussed last week is still unfolding and will likely take time and effort to stop the prior strong bullish momentum.
3 Stocks Ready To Soar
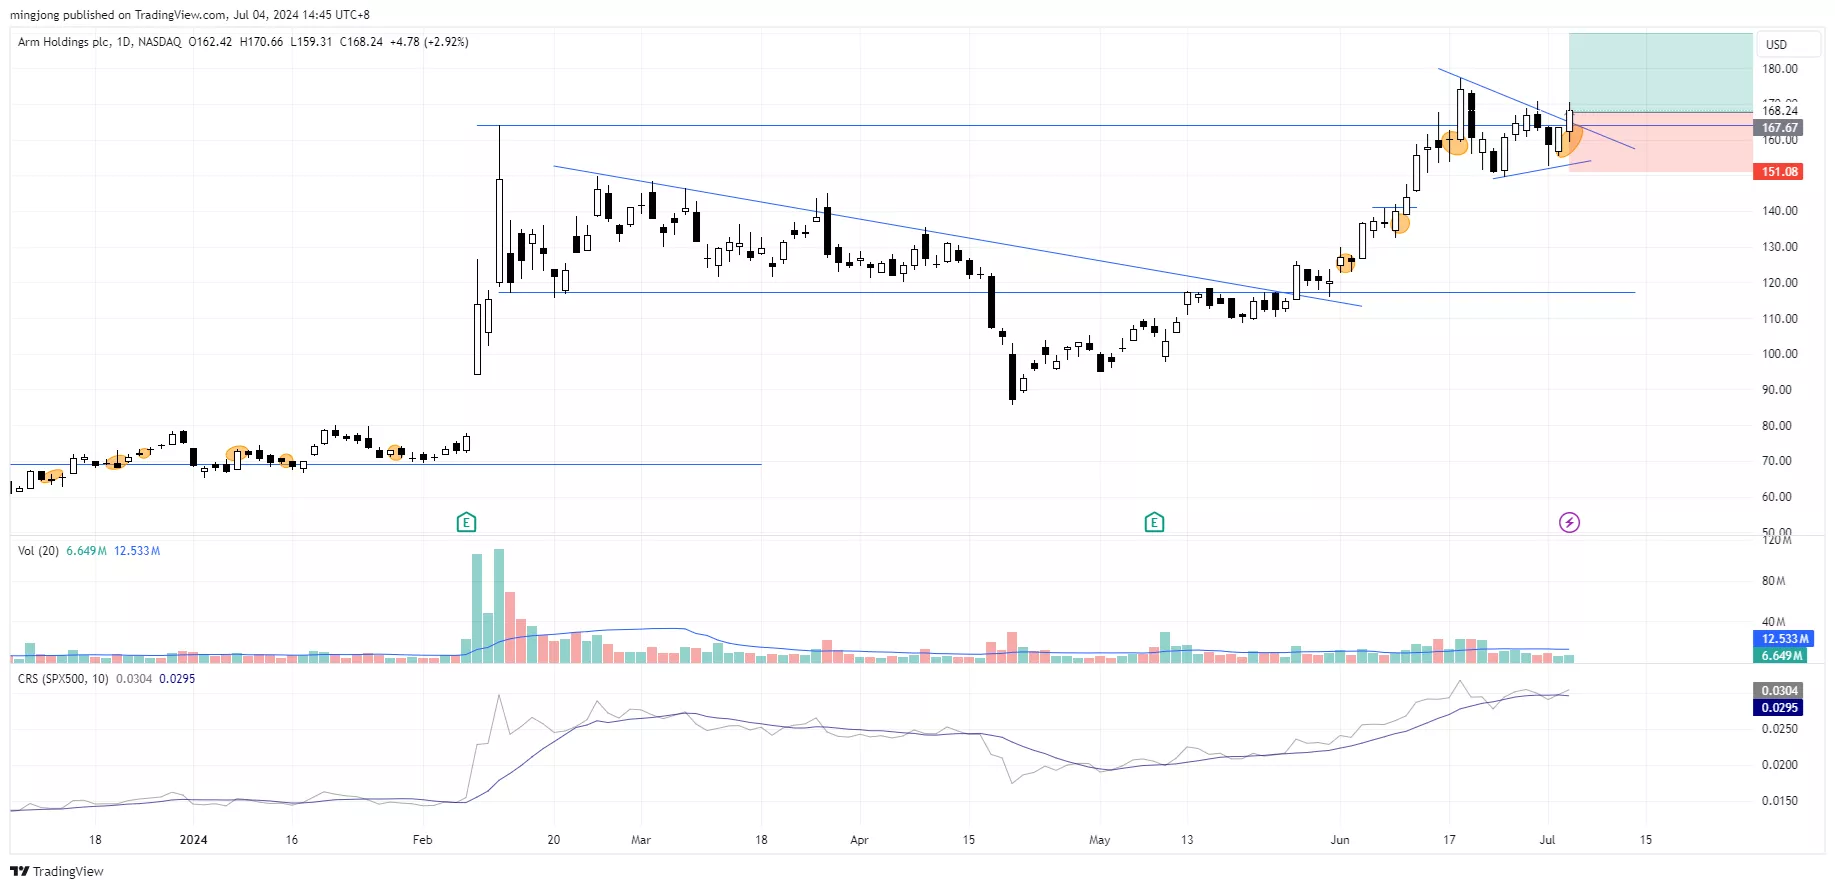
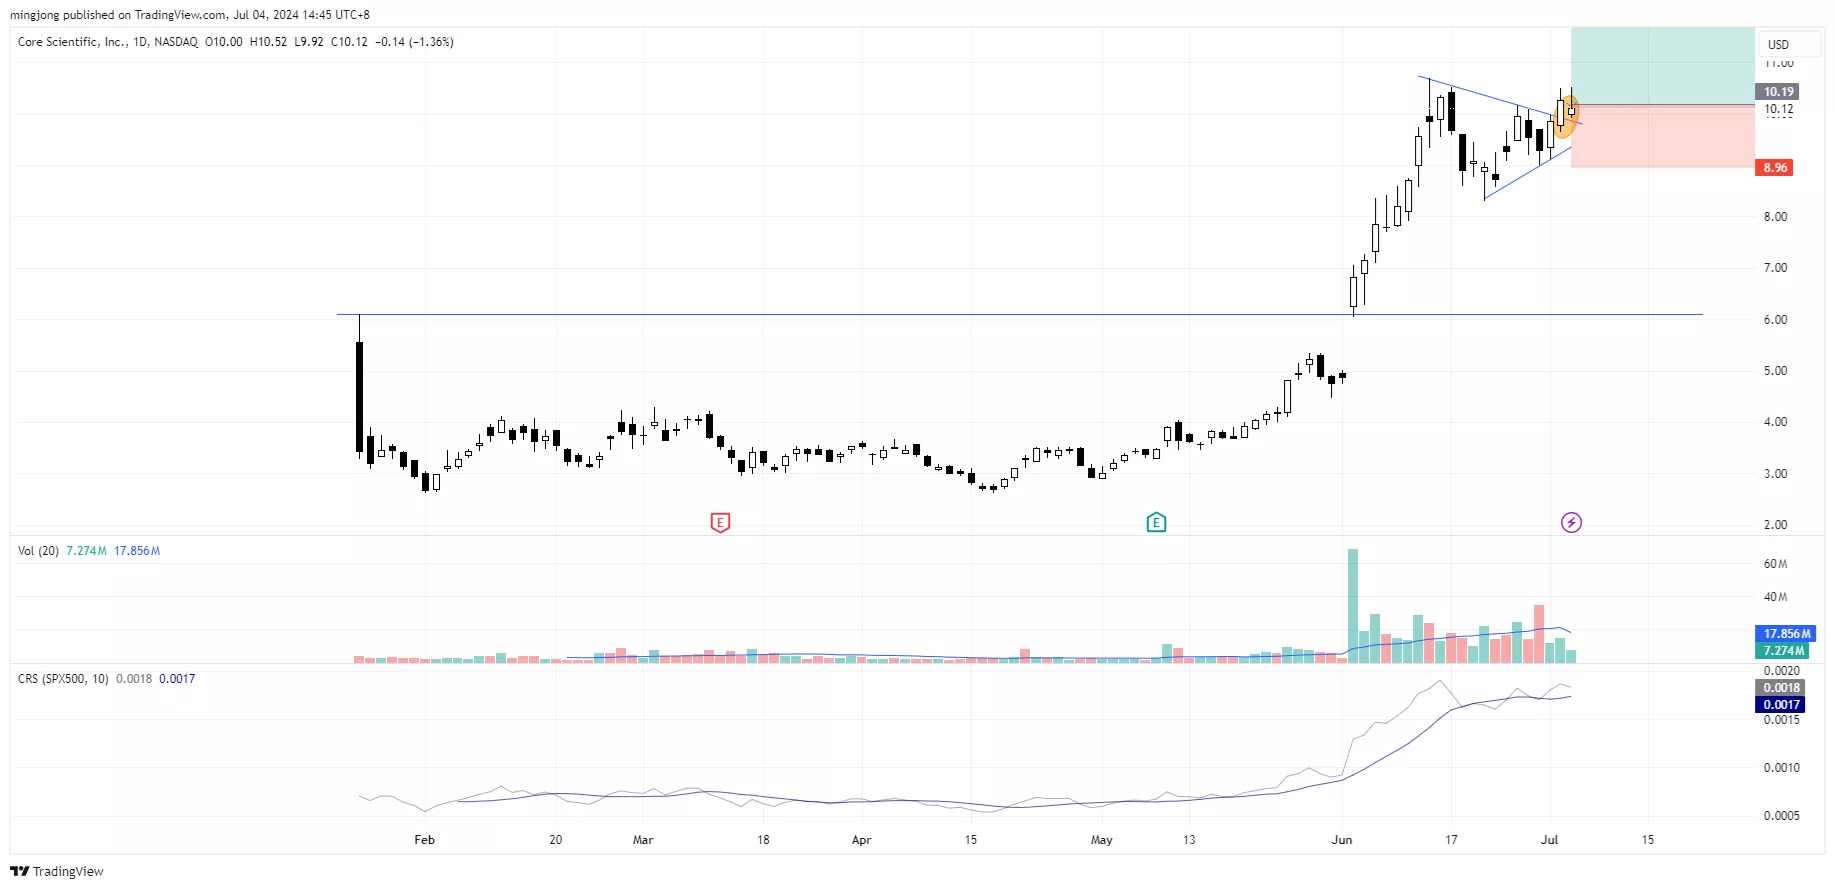
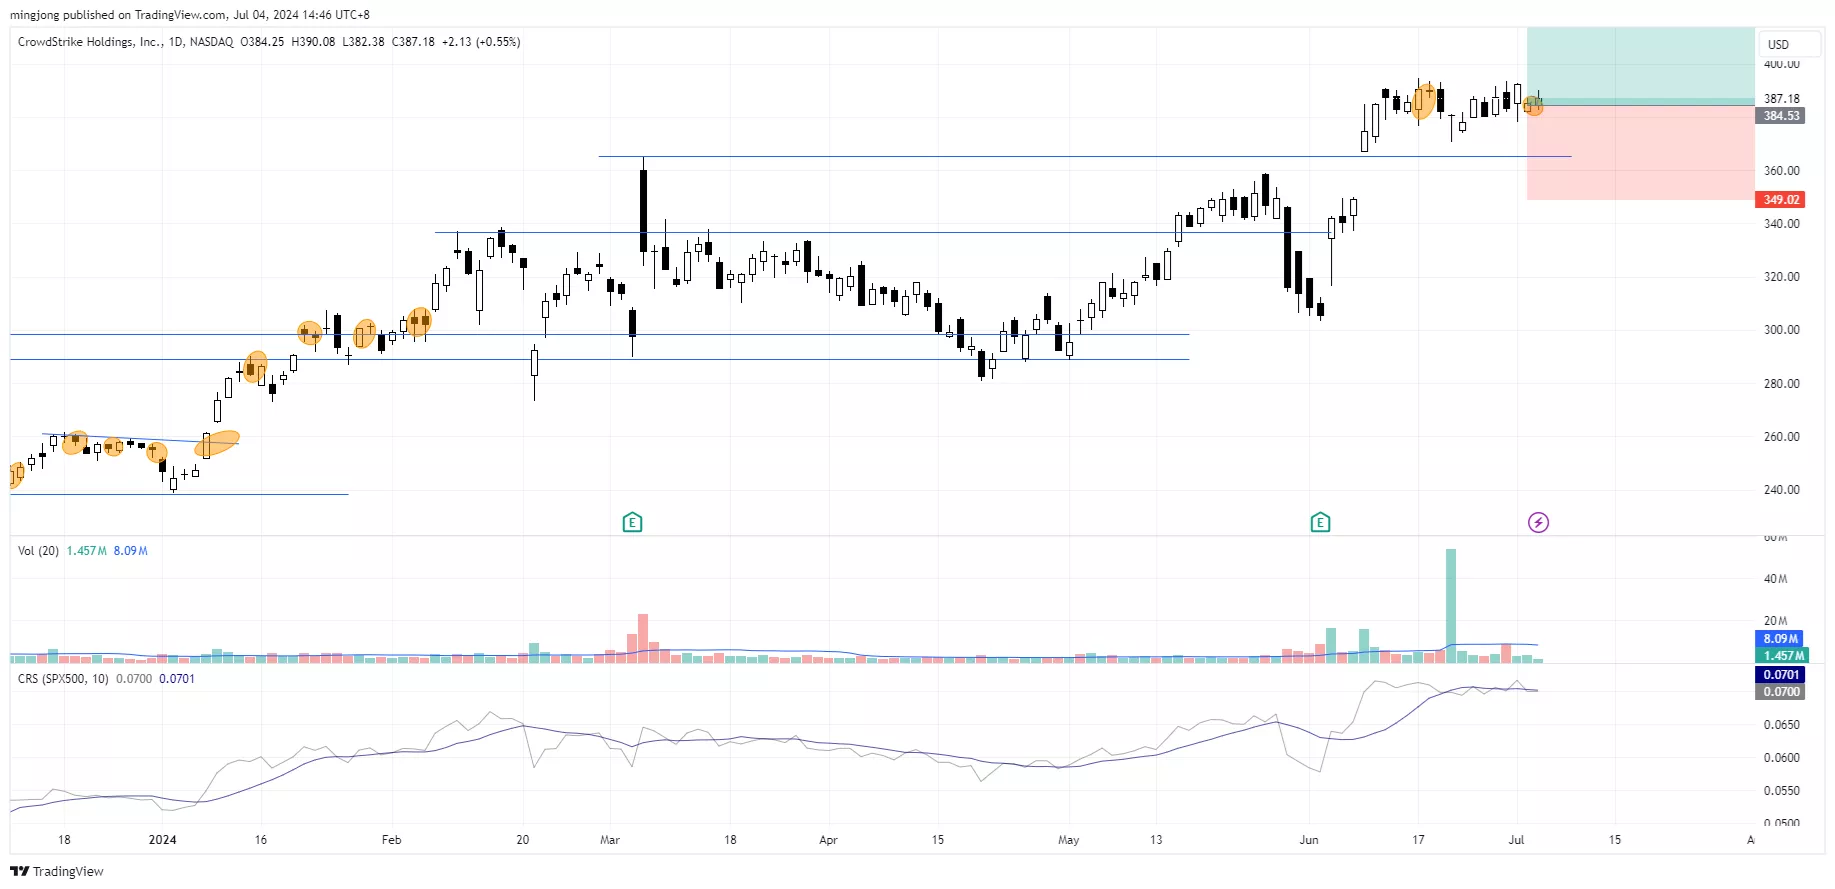
14 “low-hanging fruits” ARM, CORZ trade entries setups + 20 actionable setups CRWD were discussed during the live session before the market open (BMO).
(Click on image to enlarge)
(Click on image to enlarge)
(Click on image to enlarge)
More By This Author:
Nasdaq 100 Overbought? Here’s What History Says About The Current Rally
Market Breadth Divergence: Bullish Or Bearish?
Is The S&P 500 Ready For A Breakout?


Comments
Log in or sign up to join the conversation.