
Four Charts Every Trader Needs To See Today
The S&P 500 looks primed for a correction of sorts.
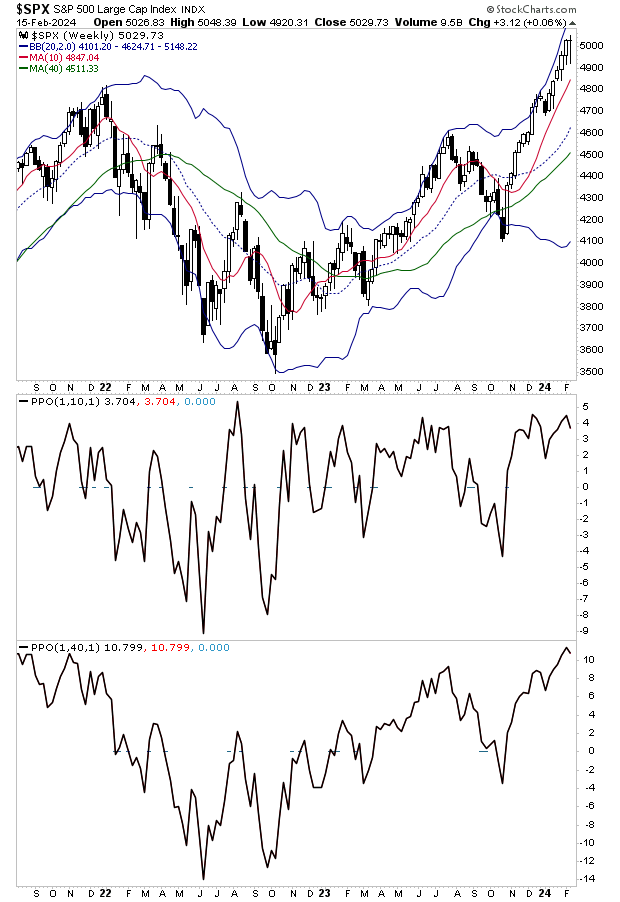
As I’ve noted previously, the S&P 500 is quite extended above both its 10-week moving average (same as the 50-DMA) as well as the 40-week moving average (same as the 200-DMA). Historically, this degree of extension above both trendlines has marked a temporary top as the below chart illustrates.
(Click on image to enlarge)
Beyond this, NO sector is outperforming the S&P 500 at this time (maybe with the exception of Communication Services).
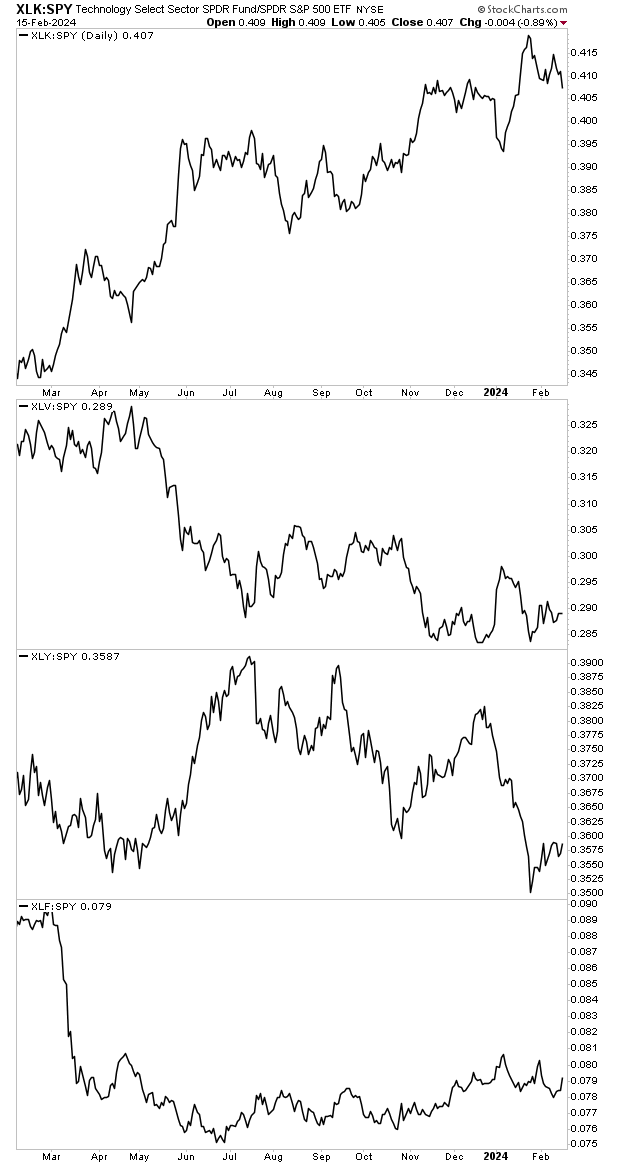
Below are three charts showing the ratio performance between each sector in the S&P 500 and the broader index. When the individual sector outperforms, the line rises. When the individual sector underperforms, the line falls. As you’ll note, NO SECTOR is leading the market higher right now.
Tech, Healthcare, Consumer Discretionary and Financials:
(Click on image to enlarge)
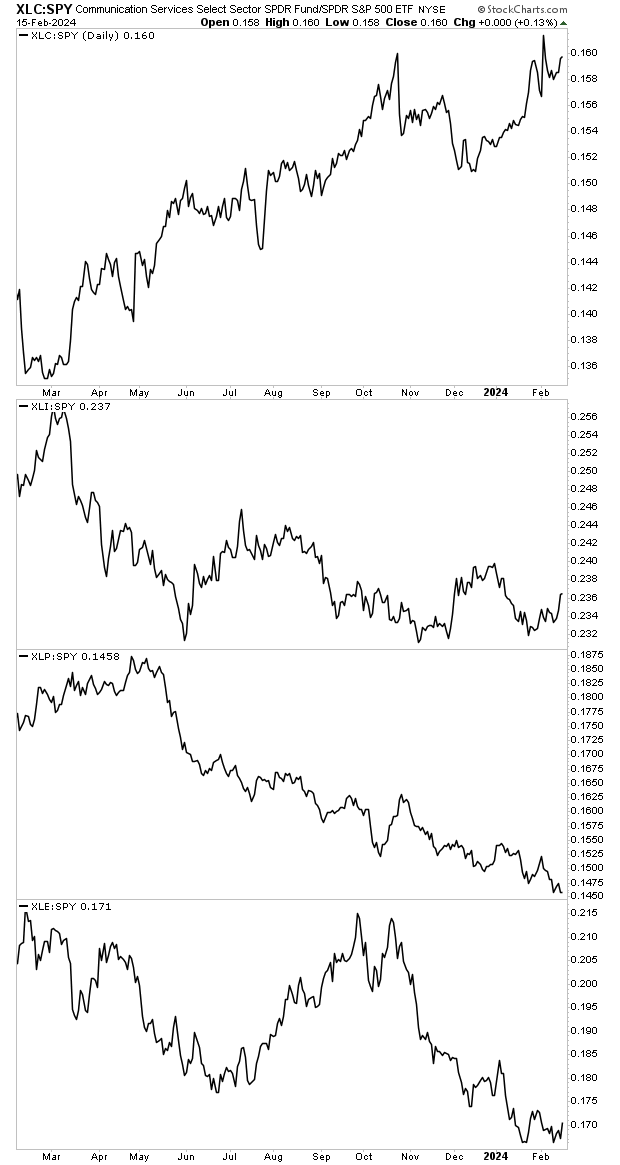
Communication Services, Industrials, Consumer Staples, and Energy.
(Click on image to enlarge)
Utilities, Real Estate and Materials:
(Click on image to enlarge)
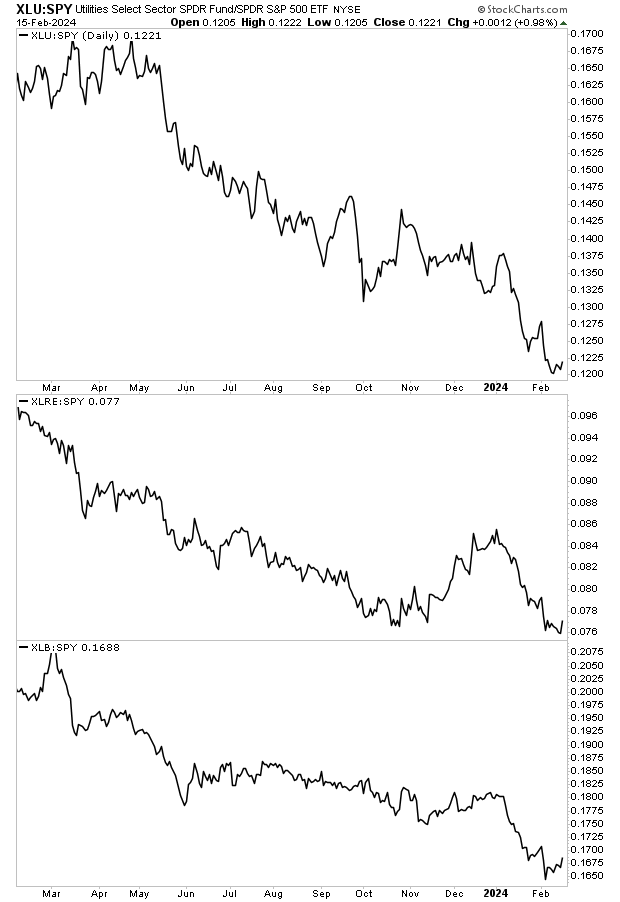
Looking at the above ratios, we note that Tech, Consumer Discretionary, Financials and Real Estate lead the market higher during the rally from early November until the end of 2023. However, today, not one single sector is leading the overall market higher (maybe with the exception of Communication Services). Even the Tech sector, which usually is a market leader has been underperforming the broader index since January.
So how has the market held up despite every sector underperforming?
A handful of stocks have pulled the overall market higher. Specifically, Nvidia (NVDA), Amazon (AMZN), Meta (META), and Eli Lilly & CO (LLY). Remove those companies from the S&P 500 and stocks are effectively flat.
Add it all up, and the above analysis suggests that “under the surface” the S&P 500 could see a decent correction of 5% or more in the coming weeks. Only a small handful of stocks are holding everything up. This combined with our overbought and overextended the market is suggests the momentum for the next market move will be DOWN.
More By This Author:
I Have A Serious Question For YouMarket Forecast Based On Earnings So Far
Three Charts Every Trader Needs To See


