Three Charts Every Trader Needs To See
Stocks aren’t taking a breather.
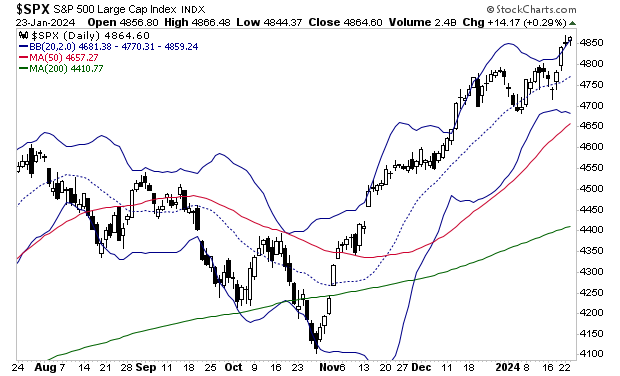
The S&P 500 is up nearly 150 points in just five sessions. This has been quite a move. And what’s truly extraordinary is that every intraday dip is being bought aggressively.

However, a word of caution here.
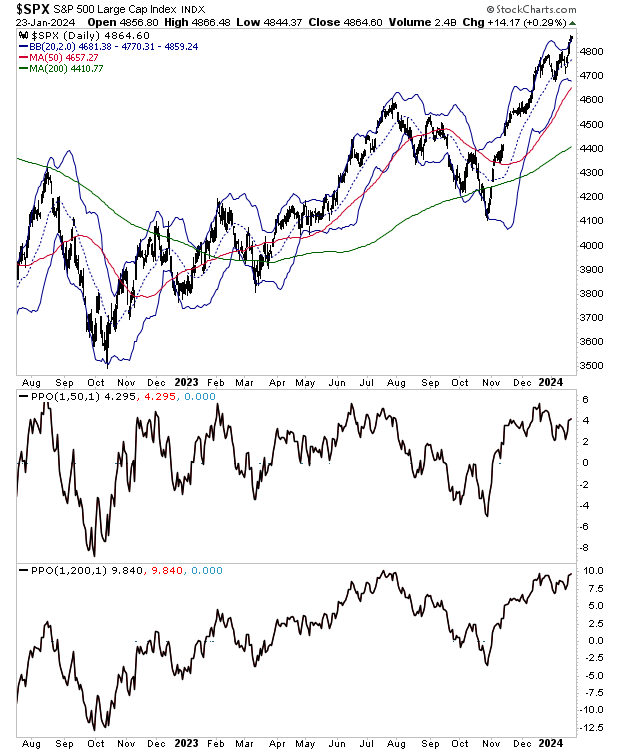
The S&P 500 is now 4% above its 50-Day Moving Average (DMA) and 9.8% above its 200-DMA. Over these last 18 months, any time the index has become this extended above its trend has resulted in a short term peak. So, it wouldn’t be surprising to see the S&P 500 correct down to back-test the recent breakout at 4,790.

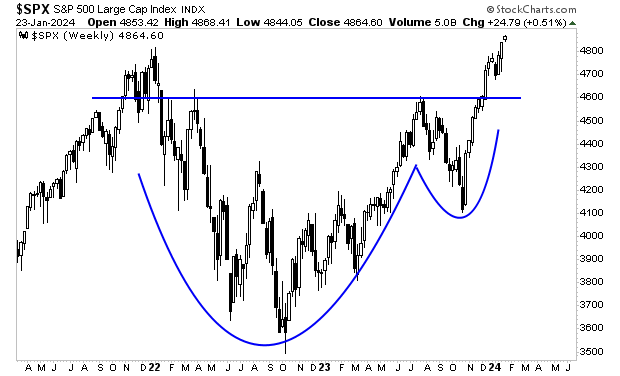
After that, the door is open to 5,000 on the S&P 500. The Cup and Handle formation I outlined a few weeks ago has broken to the upside. Long-term (later in 2024) we are likely going MUCH higher.

More By This Author:
The U.S. Government Has Set The Stage For A Debt CrisisOne Of The Indicators For Timing The Market Is Flashing A Warning
Did You Catch That Move Higher?


