Extremes In Everything
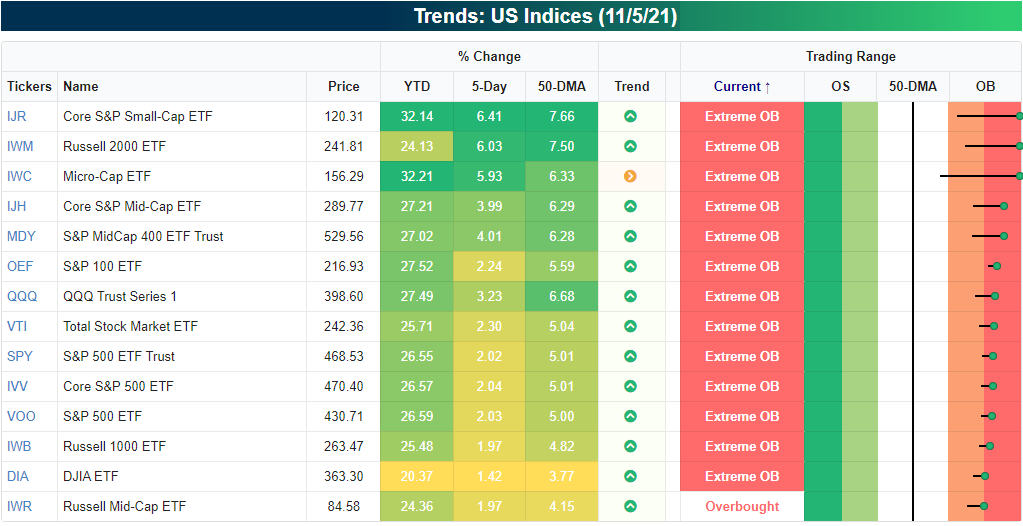
Across major US equity indices, regardless of market cap, the picture is the same: extreme overbought. As shown in the snapshot of our Trend Analyzer below, the Russell Mid-Cap ETF (IWR) was the only major index ETF that did not finish last Friday at least two standard deviations above its 50-DMA. With that said, IWR still finished the week at very overbought levels and only slightly below extreme overbought levels. For the most part, other mid-cap ETFs were some of the most overbought last week like the Core S&P Mid-Cap ETF (IJH) and S&P MidCap 400 ETF (MDY). Small-caps are even more extended with the Core S&P Small-Cap ETF (IJR), Russell 2,000 ETF (IWM), and Micro-Cap ETF (IWC) all off the chart overbought.
(Click on image to enlarge)

Again, looking across the four major US indices, each one is at ‘extreme’ overbought levels with a z-score reading at the high end of the past decade’s range. In the charts below, we show charts of how far the S&P 500, Nasdaq Composite, Dow Jones Industrial Average, and Russell 2,000 are trading from their 50-DMAs as measured in standard deviations. For large caps and the Nasdaq, the current readings are some of the highest since the summer. For the Russell 2,000, no point in the past decade has seen a more elevated reading. In fact, Friday’s close saw the Russell 2,000 finish 3.23 standard deviations above its 50-DMA; the most elevated reading since February 1991.
(Click on image to enlarge)


