

Image Source: Unsplash
O'Reilly Automotive Inc., Elliott Wave Technical Analysis
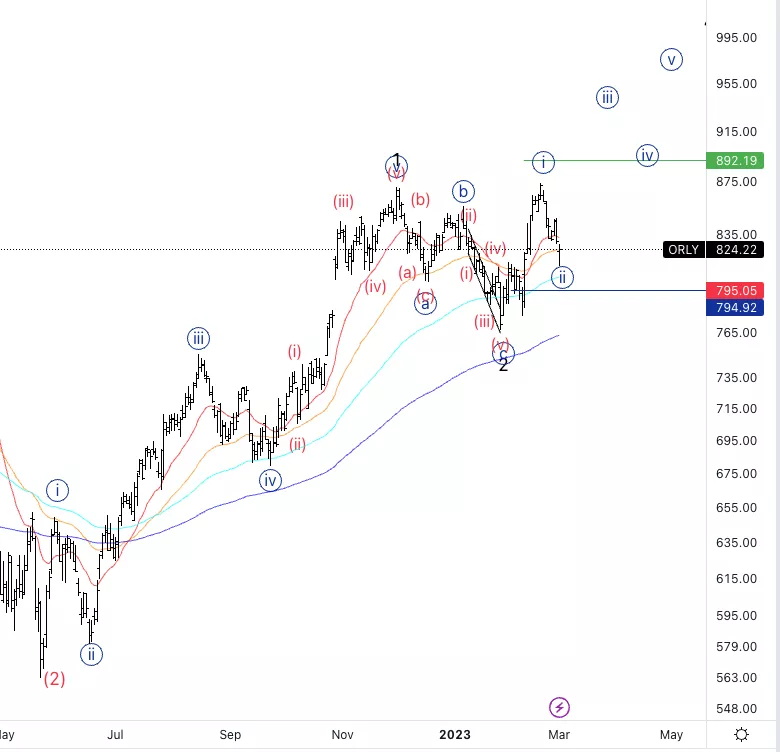
O'Reilly Automotive Inc., (Nasdaq: ORLY): Daily Chart, 2 March 2023.
ORLY Stock Market Analysis: At this point, the overall count has changed as we are either in wave {ii} of 3 or else in wave {c} of 2.
ORLY Elliott Wave Count: Wave {ii} of 3.
ORLY Technical Indicators: Below 20EMA average.
ORLY Trading Strategy: Looking for a bottom in wave {ii} to then look for longs.
Analyst: Alessio Barretta
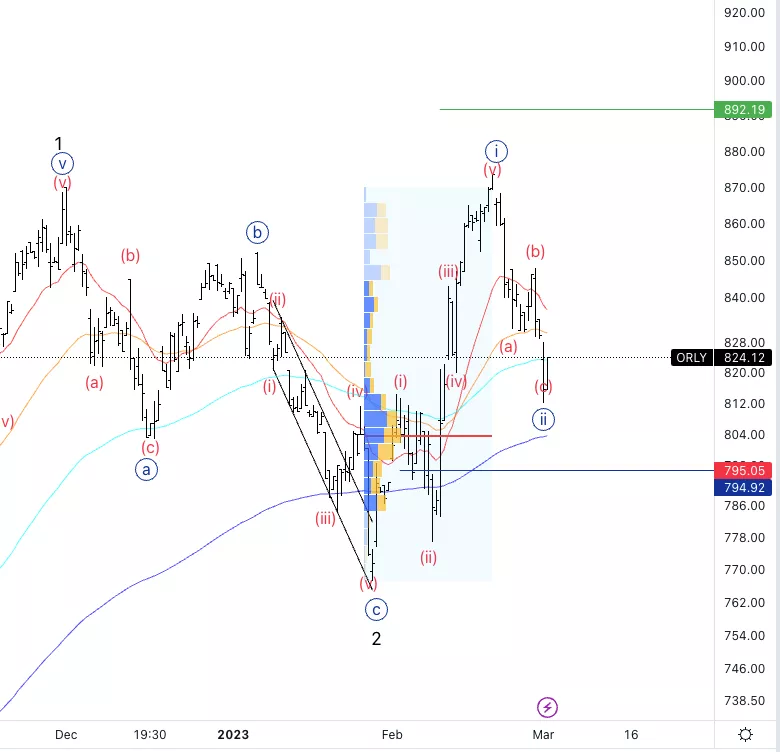
O'Reilly Automotive Inc., ORLY: 4-hour Chart, 2 March 2023.
O'Reilly Automotive Inc., Elliott Wave Technical Analysis
ORLY Stock Market Analysis: Looking for a three wave move in wave {ii} to be nearly completed, to then look for additional longs as we are also near the volume point of control.
ORLY Elliott Wave count: Wave (c) of {ii}.
ORLY Technical Indicators: In between averages
ORLY Trading Strategy: Looking for a bottom in wave (c) to then look for longs.
More By This Author:
Elliott Wave Technical Analysis: NEO / U.S. Dollar - Thursday, March 2
U.S. Stock Market Elliott Wave Technical Analysis
Elliott Wave Technical Analysis: Intuitive Surgical Inc. - Wednesday, March 1


Comments
Log in or sign up to join the conversation.