

Image Source: Unsplash
Intuitive Surgical Inc., Elliott Wave Technical Analysis
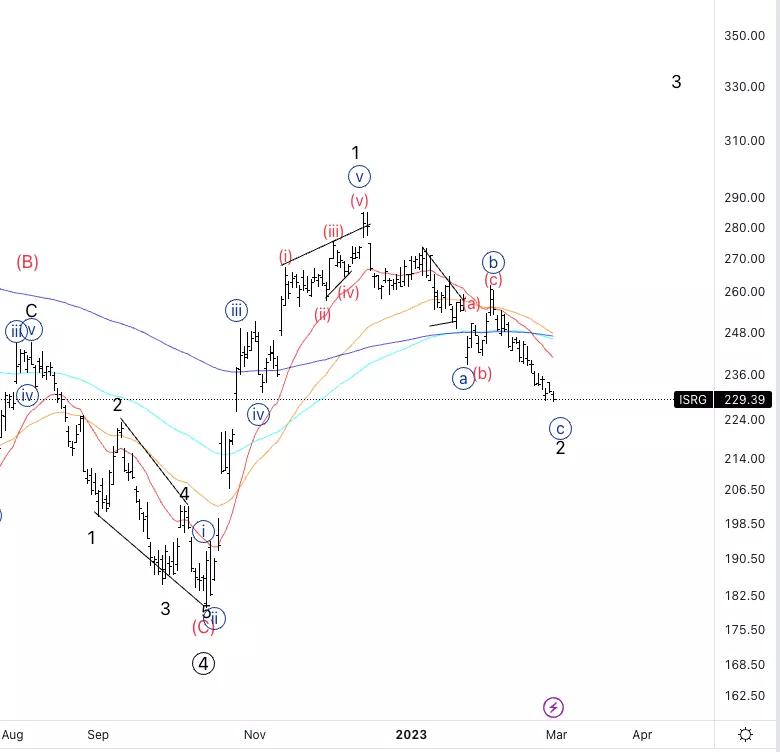
Intuitive Surgical Inc., (Nasdaq: ISRG): Daily Chart, 1 March 2023.
ISRG Stock Market Analysis: Looking for further a bottom in wave {c} at it has reached 0.618 {c] vs. {a}. Looking for a turn-up soon.
ISRG Elliott Wave Count: Wave {c} of 2.
ISRG Technical Indicators: Below all averages.
ISRG Trading Strategy: Looking for a bottom in wave 2 to then look for longs.
Analyst: Alessio Barretta
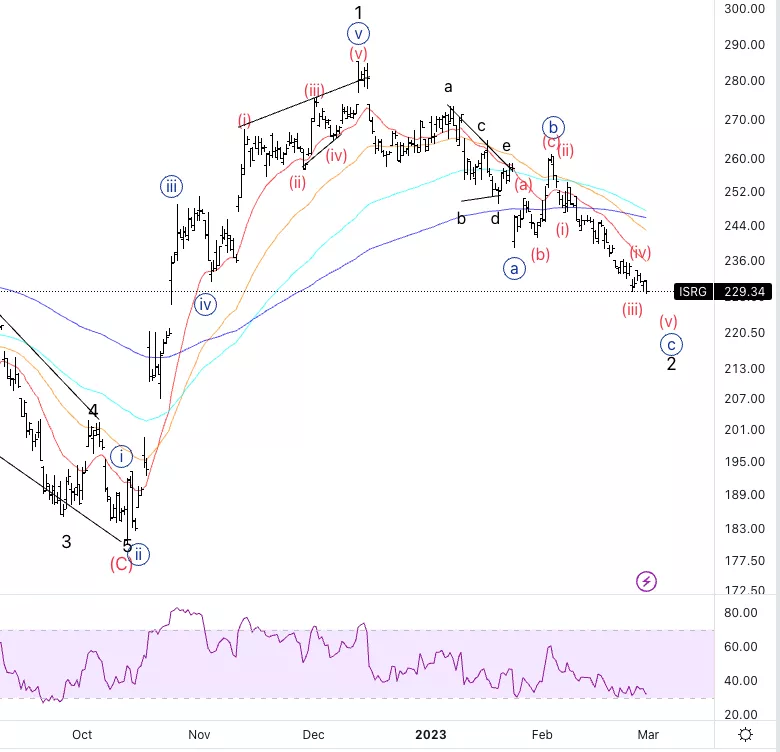
Intuitive Surgical Inc., ISRG: 4-hour Chart, 1 March 2023.
Intuitive Surgical Inc., Elliott Wave Technical Analysis
ISRG Stock Market Analysis: Looking for five waves into wave {c} and it looks like we are in wave (v). We are starting to see RSI divergence which could signify we are near the end of the trend.
ISRG Elliott Wave count: Wave (v) of {c}.
ISRG Technical Indicators: Below all averages.
ISRG Trading Strategy: Looking for a bottom in wave 2 to then look for longs.
More By This Author:
Elliott Wave Technical Analysis: Bitcoin/US Dollar, Wednesday, Mar. 1
Elliott Wave Technical Analysis: Intuit Inc. - Tuesday, Feb. 28
Elliott Wave Technical Analysis: Uniswap / U.S. Dollar - Tuesday, Feb. 28


Comments
Log in or sign up to join the conversation.