Tuesday, February 28, 2023 9:08 AM EST
![person using MacBook Pro on table](https://images.unsplash.com/photo-1569025690938-a00729c9e1f9?ixlib=rb-1.2.1&ixid=eyJhcHBfaWQiOjEyMDd9&auto=format&fit=crop&w=1000&q=80)
Image Source: Unsplash
Intuit Inc., Elliott Wave Technical Analysis
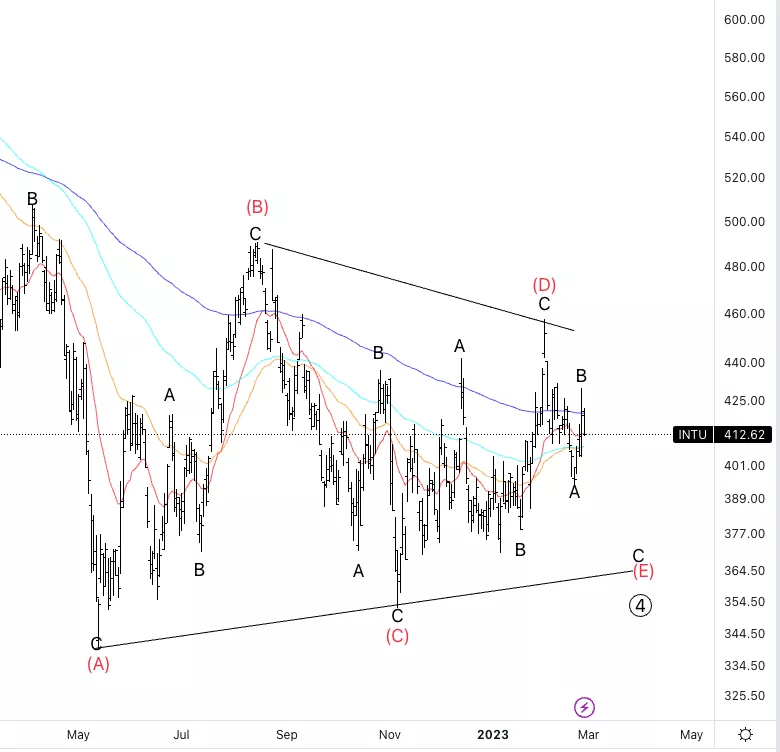
Intuit Inc., (Nasdaq: INTU): Daily Chart, 28 February 23,
INTU Stock Market Analysis: After the trade-in INTU where we got stopped at breakeven, it is still moving as expected. It looks like it made three waves down into wave A and it is now retracing into wave B finding resistance on the 200EMA.
INTU Elliott Wave Count: Wave B of (E).
INTU Technical Indicators: Resistance on the 200EMA.
INTU Trading Strategy: Looking for further downside into wave C.
Analyst: Alessio Barretta
![](https://talkmarkets.com/contributor/tradinglounge/user_content/ckimages/orig_intu_2_28.webp)
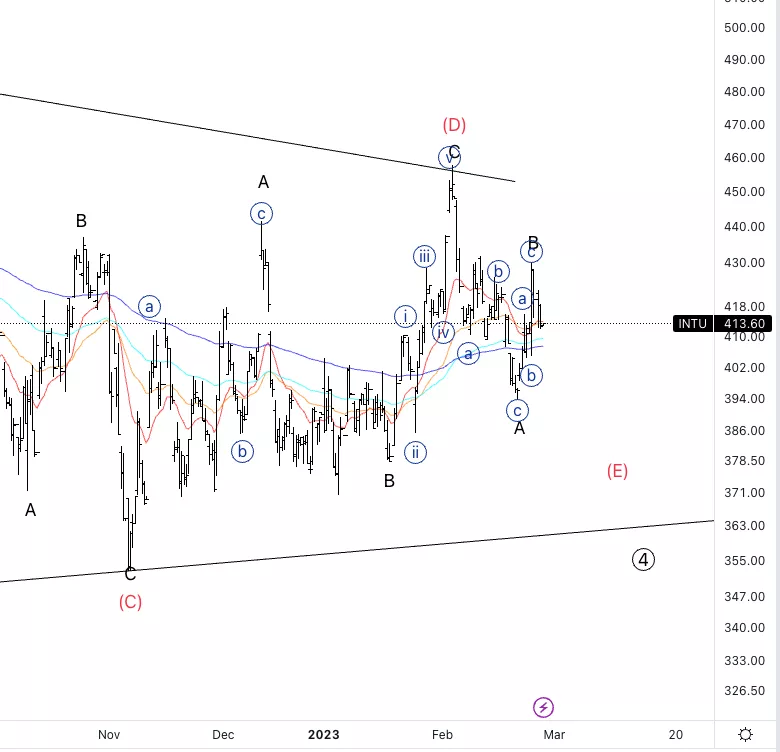
Intuit Inc., INTU: 4-hour Chart, 28 February 2023.
Intuit Inc., Elliott Wave Technical Analysis
INTU Stock Market Analysis: Moving as expected, it looks like wave B could be finished or else we just completed wave {a} of B. Looking for further downside.
INTU Elliott Wave count: Wave (iv) of {c}.
INTU Technical Indicators: Averages crossing.
INTU Trading Strategy: Looking further downside into wave C.
![](https://talkmarkets.com/contributor/tradinglounge/user_content/ckimages/orig_intu_4h_638131712938634182.webp)
More By This Author:
Bitcoin Technical Analysis - Bitcoin and the Nasdaq
Elliott Wave Technical Analysis: Elbit, Monday, Feb. 27
Elliott Wave Technical Analysis: Ethereum /U.S. Dollar, Monday, Feb. 27
Disclosure: As with any trading or investment opportunity there is a risk of making losses especially in day trading or investments that Trading Lounge expresses opinions on. Note: Historical ...
more
Disclosure: As with any trading or investment opportunity there is a risk of making losses especially in day trading or investments that Trading Lounge expresses opinions on. Note: Historical trading results are no guarantee of future returns. Some investments are inherently more risky than others. At worst, you could lose your entire investment and more TradingLounge™ uses a range of technical analysis tools, such as Elliott Wave, software and basic fundamental analysis as well as economic forecasts aimed at minimising the potential for loss. The advice we provide through our TradingLounge™ websites and our TradingLounge™ Membership has been prepared without taking into account your particular objectives, financial situation or needs. Reliance on such advice, information or data is at your own risk. The decision to trade and the method of trading is for you alone to decide, tradinglounge takes no responsibility whatsoever for your trading profits or losses. This information is of a general nature only, so you should, before acting upon any of the information or advice provided by us, consider the appropriateness of the advice in light of your own objectives, financial situation or needs. Therefore, you should consult your financial advisor or accountant to determine whether trading in Indices Stocks shares Forex CFDs Options Spread Betting derivatives of any kind / products is appropriate for you in light of your financial trading circumstances.
less
How did you like this article? Let us know so we can better customize your reading experience.