
Elliott Wave Analysis TradingLounge Daily Chart, Wednesday, March 1.

Bitcoin/U.S. Dollar (BITCOMP)
UNIUSD Elliott Wave Technical Analysis
Function: Counter trend
Mode: Corrective
Structure: Flat
Position: Wave C
Direction Next higher Degrees: wave (I) of Impulse
Details: Retracement of wave ((2)) usually .50 or .618 x Length wave ((1))
Wave Cancel invalid Level: 4.9475
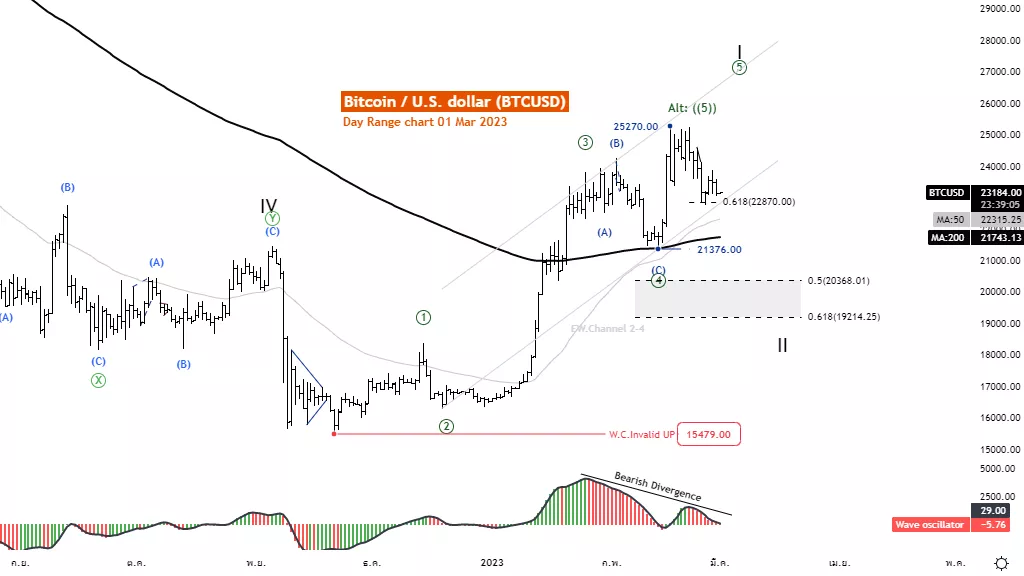
Bitcoin/U.S. Dollar (BTCUSD) Trading Strategy: Bitcoin is likely to end at 25270, but we are still missing confirmation on this idea from the five-wave movement in the downward direction. Therefore, it is possible that the price is likely to go higher. But even so, the fifth wave It is the last of five warning waves before a trend change or correction. Trading during this period must be done with caution.
Bitcoin/U.S. Dollar (BTCUSD)Technical Indicators: The price is above the MA200 indicating an Up Trend. The wave oscillators above Zero-Line momentum are bullish.
TradingLounge Analyst: Kittiampon Somboonsod
Elliott Wave Analysis TradingLounge 4H Chart, March 1
Bitcoin/U.S. Dollar (BTCUSD)
BTCUSD Elliott Wave Technical Analysis
Function: Follow trend
Mode: Motive
Structure: Impulse
Position: Wave ((5))
Direction Next higher Degrees: wave I of Motive
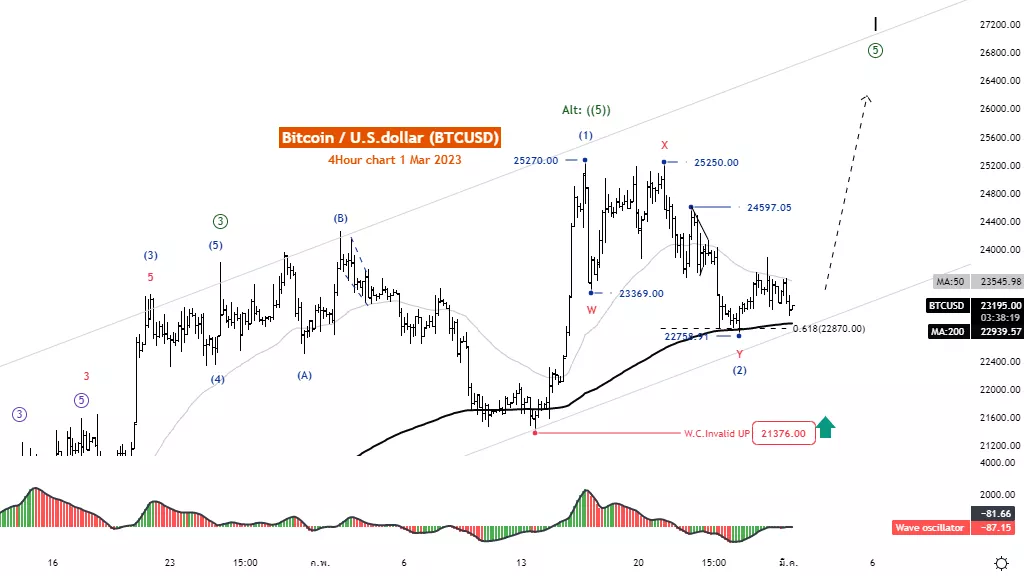
Details: Wave ((5)) is likely to end at 25270 but the lack of five wave moves from 25270 means we can still expect a rise above 25270. Watch out for a retracement in wave II.
Wave Cancel invalid level: 21376
Bitcoin/U.S. Dollar (BTCUSD)Trading Strategy: Bitcoin is likely to end at 25270, but we are still missing confirmation on this idea from the five-wave movement in the downward direction. Therefore, it is possible that the price is likely to go higher. But even so, the fifth wave It is the last of five warning waves before a trend change or correction. Trading during this period must be done with caution.
Bitcoin/U.S. Dollar (BTCUSD)Technical Indicators: The price is above the MA200 indicating an Up Trend. The wave oscillators below Zero-Line momentum are Bearish.
More By This Author:
Elliott Wave Technical Analysis: Intuit Inc. - Tuesday, Feb. 28
Elliott Wave Technical Analysis: Uniswap / U.S. Dollar - Tuesday, Feb. 28
Bitcoin Technical Analysis - Bitcoin and the Nasdaq


Comments
Log in or sign up to join the conversation.