

Image Source: Pixabay
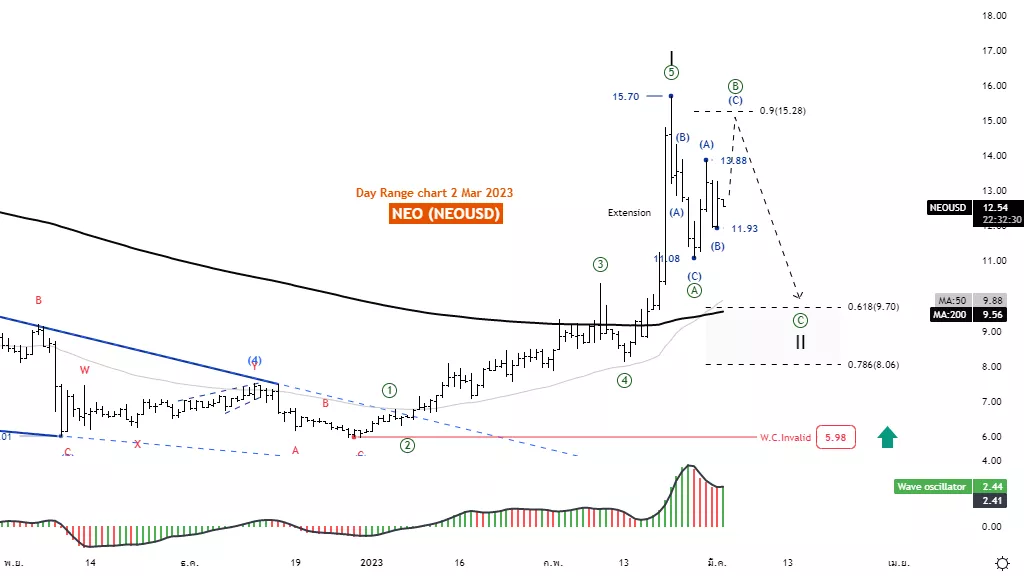
Elliott Wave Analysis TradingLounge Daily Chart, 02 March 2023.
NEO / U.S. Dollar (NEOUSD)
Elliott Wave Technical Analysis
Function: Counter trend
Mode: Corrective
Structure: Flat
Position: Wave ((B))
Direction Next higher Degrees: Wave II of Motive
Details: Retracement of wave II usually .50 or .618 x Length wave I
Wave Cancel invalid Level: 5.98
NEO / U.S. Dollar (NEOUSD) Trading Strategy: The short-term pulling of the wave ((B)) in the Flat is usually more than 90% of the wave ((A)), allowing us to still look at the decline at a lower than 11.08.
NEO / U.S. Dollar (NEOUSD) Technical Indicators: The price is above the MA200 indicating an uptrend. The wave oscillators above Zero-Line momentum are bullish.
Analyst: Kittiampon Somboonsod
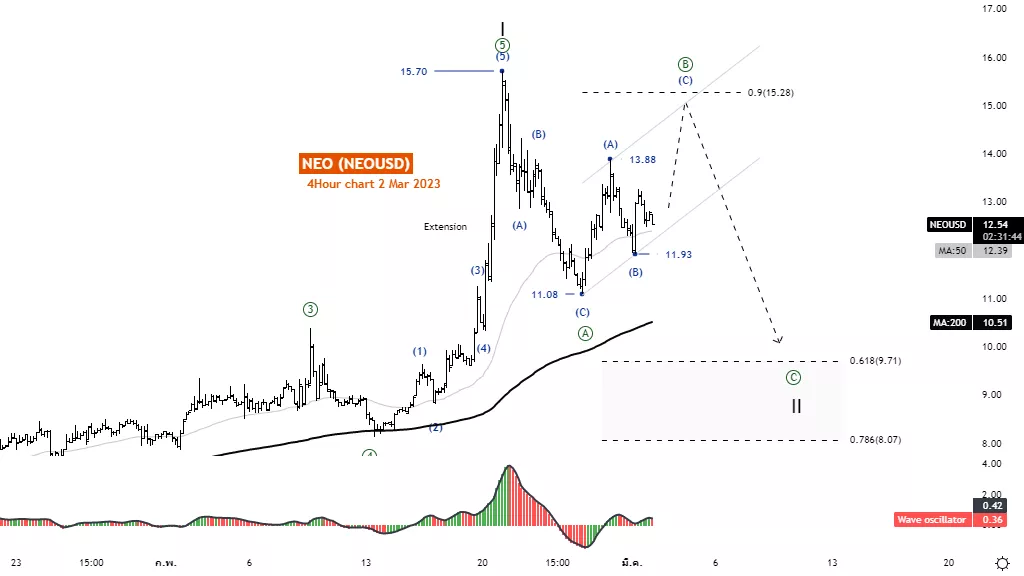
Elliott Wave Analysis TradingLounge 4H Chart, 02 March 2023.
NEO / U.S. Dollar (NEOUSD)
Elliott Wave Technical Analysis
Function: Counter trend
Mode: Corrective
Structure: Flat
Position: Wave ((B))
Direction Next higher Degrees: Wave II of Motive
Details: Returning pulling ((B)) is usually 90% of the wave ((A)).
Wave Cancel invalid Level: 5.98
NEO / U.S. Dollar (NEOUSD) Trading Strategy: The short-term pulling of the wave ((B)) in the Flat is usually more than 90% of the wave ((A)), allowing us to still look at the decline at a lower than 11.08.
NEO / U.S. Dollar (NEOUSD) Technical Indicators: The price is above the MA200 indicating an uptrend. The wave oscillators above Zero-Line momentum are bullish.
More By This Author:
U.S. Stock Market Elliott Wave Technical Analysis
Elliott Wave Technical Analysis: Intuitive Surgical Inc. - Wednesday, March 1
Elliott Wave Technical Analysis: Bitcoin/US Dollar, Wednesday, Mar. 1


Comments
Log in or sign up to join the conversation.