

Image Source: Unsplash
Gilead Inc., Elliott Wave Technical Analysis
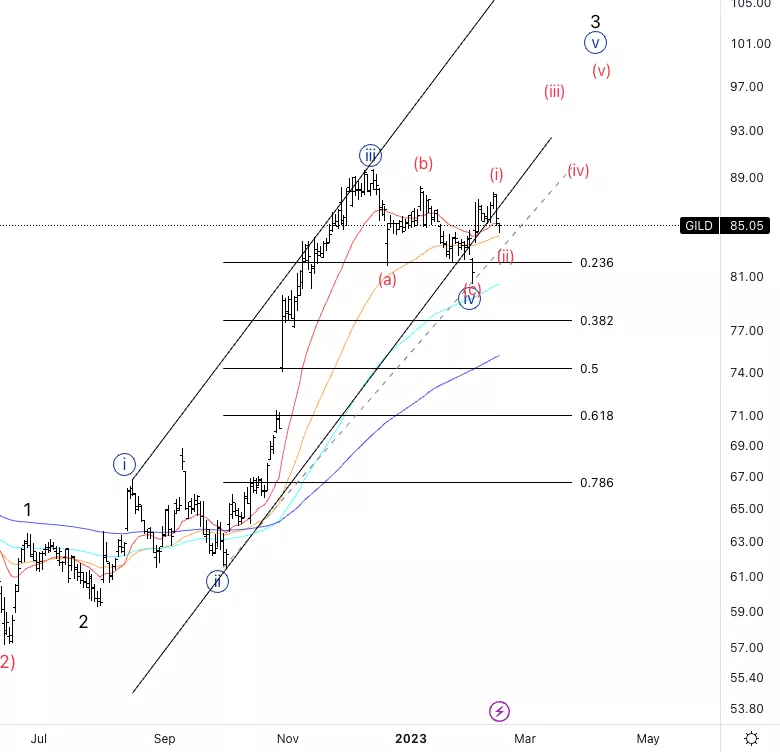
Gilead Inc., (Nasdaq: GILD): Daily Chart, 16 February 2023.
GILD Stock Market Analysis: It has been moving higher after a clear five wave move which seems to be completed to then resume higher.
GILD Elliott Wave Count: Wave (ii) of {v}.
GILD Technical Indicators: 20EMA as support.
GILD Trading Strategy: Looking for the end of wave (ii).
Analyst: Alessio Barretta
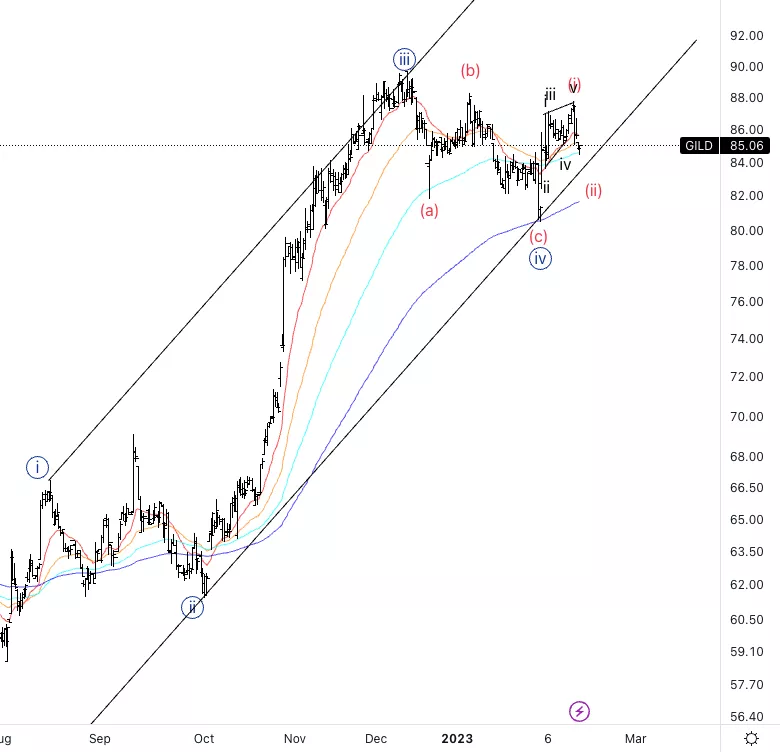
Gilead Inc., GILD: 4-hour Chart, 16 February 2023.
Gilead Inc., Elliott Wave Technical Analysis
GILD Stock Market Analysis: It looks like we have had a diagonal in wave (i) and we are now ready to pullback lower into wave (ii).
GILD Elliott Wave count: Wave a of (ii).
GILD Technical Indicators: In between averages.
GILD Trading Strategy: Looking for a clear three wave move in wave (ii) to then place longs.
More By This Author:
Elliott Wave Technical Analysis: Intuitive Surgical Inc.
Elliott Wave Technical Analysis: Bitcoin /U.S. Dollar, Wednesday, Feb. 15
Elliott Wave Technical Analysis: Cisco Systems Inc.


Comments
Log in or sign up to join the conversation.