

Image Source: Unsplash
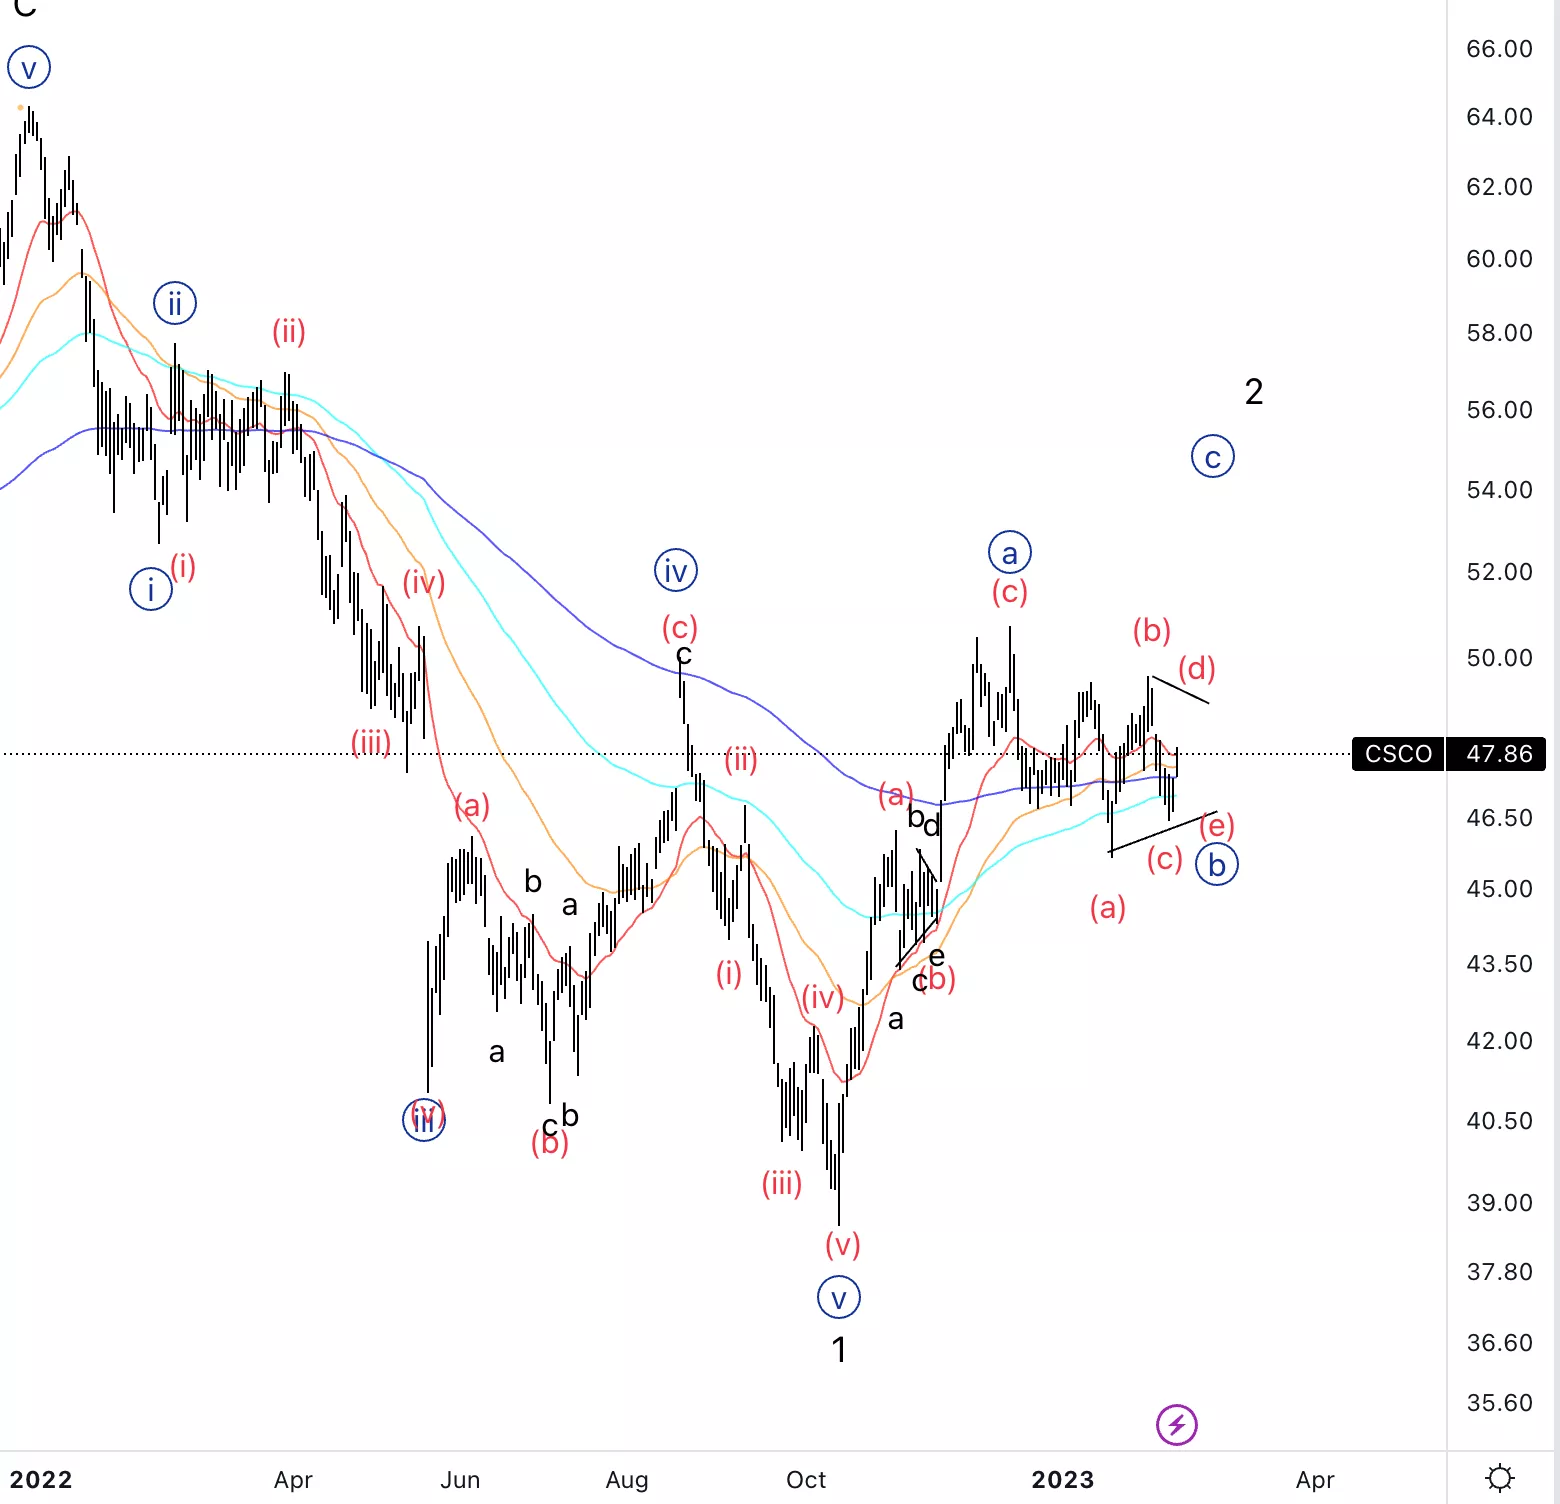
Cisco Systems Inc., Elliott Wave Technical Analysis
Cisco Systems Inc., (Nasdaq: CSCO): Daily Chart, 14 February 2023.
CSCO Stock Market Analysis: At this point, we can explore the possibility of a triangle in wave {b} of 2 to then resume higher in wave {c} and complete the three wave move to the upside.
CSCO Elliott Wave Count: Wave (c) of {b}.
CSCO Technical Indicators: Bouncing around the 200EMA, currently support.
CSCO Trading Strategy: Looking for further sideways continuation in the triangle to then enter long.
Analyst: Alessio Barretta
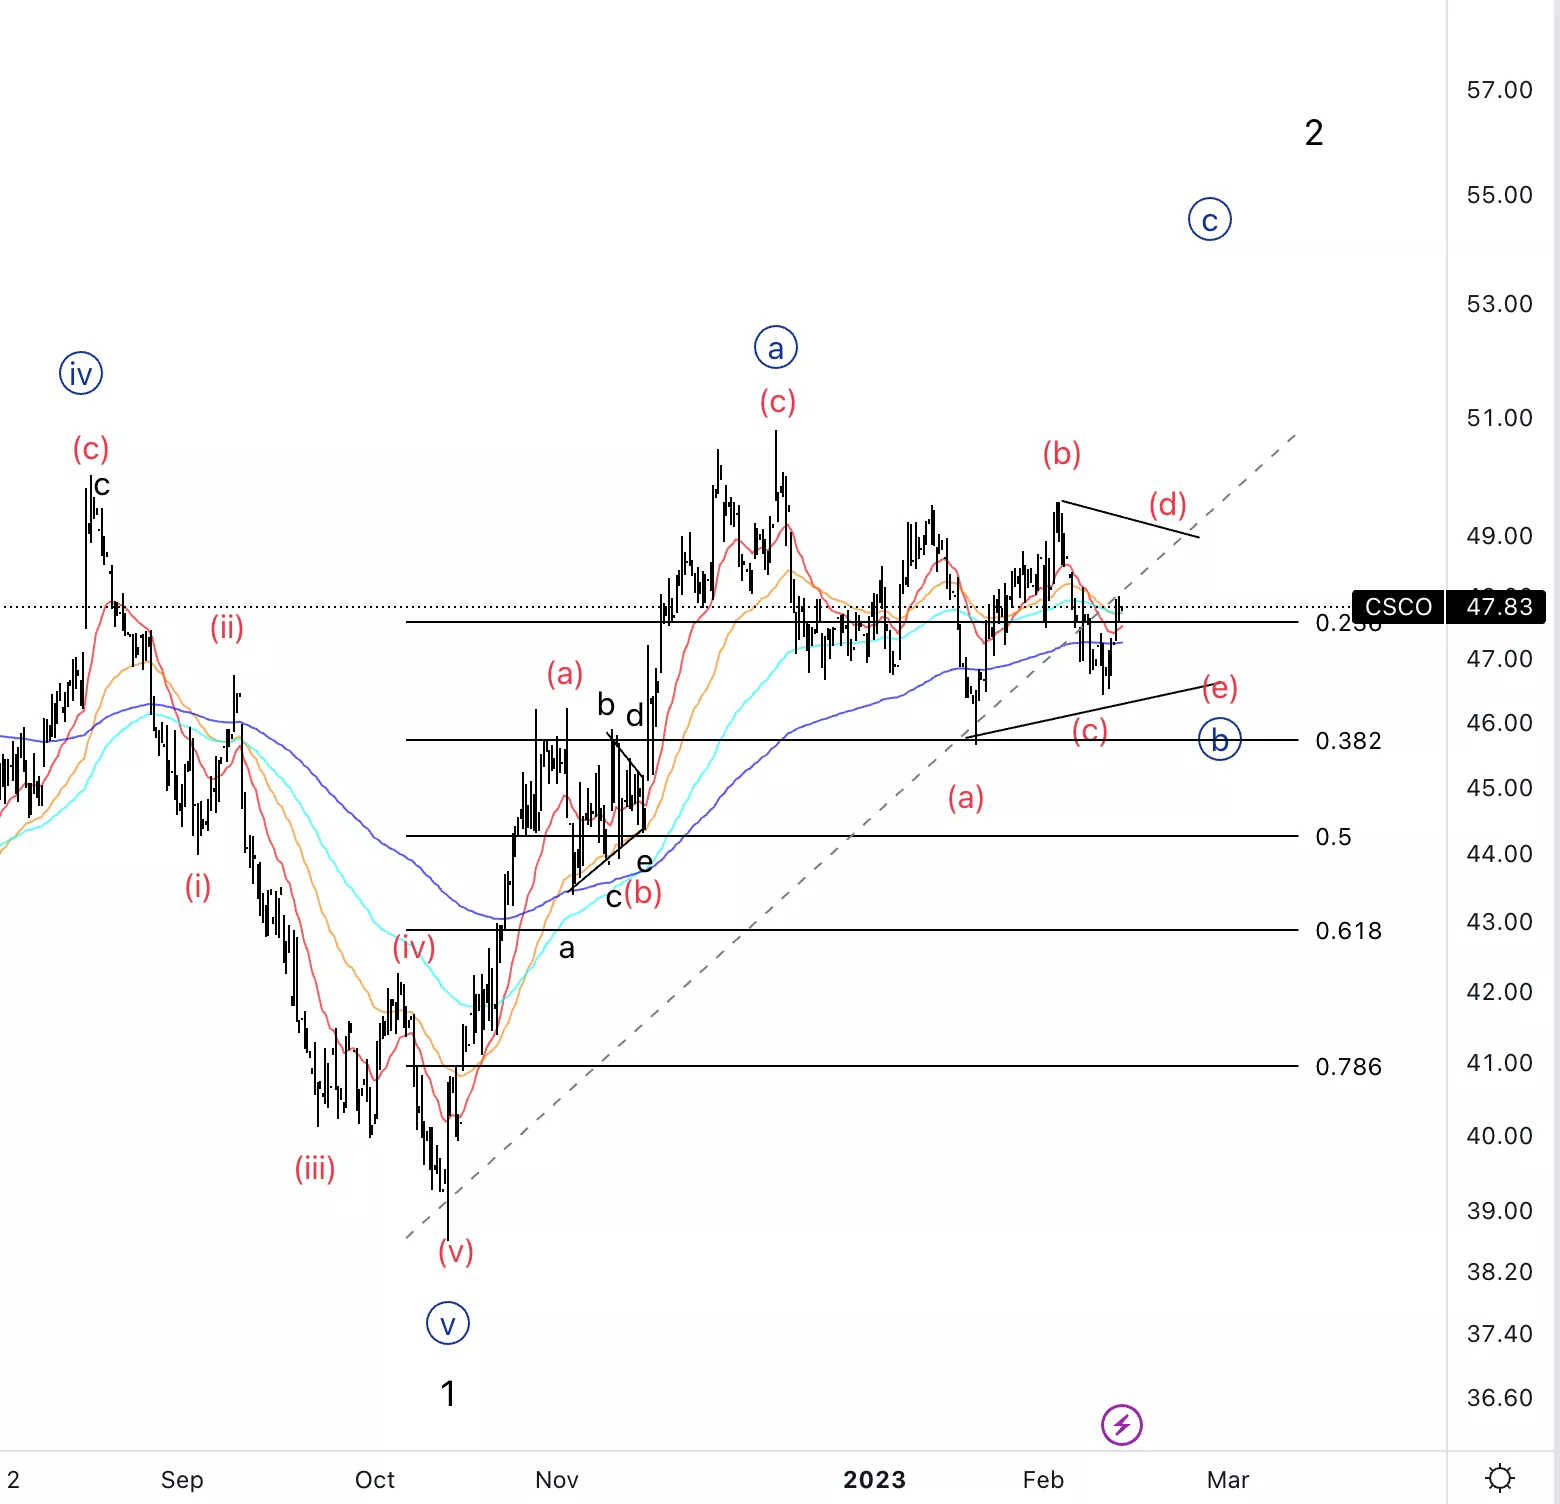
Cisco Systems Inc., CSCO: 4-hour Chart, 14 February 2023.
Cisco Systems Inc., Elliott Wave Technical Analysis
CSCO Stock Market Analysis: It is clearer on this lower timeframe chart that the price has been moving sideways and we could expect further developments before continuation higher.
CSCO Elliott Wave count: Wave (c) of {b}.
CSCO Technical Indicators: Above all averages.
CSCO Trading Strategy: Looking for further sideways continuation in the triangle to then enter long.
More By This Author:
Elliott Wave Technical Analysis: Shopify, Monday, Feb. 13
Elliott Wave Technical Analysis: Cardano-USD, Monday, Feb 13
Elevate Your Trading Results With DAX 40 Index Chart And Elliott Wave Analysis


Comments
Log in or sign up to join the conversation.