


Photo by regularguy.eth on Unsplash
Intuitive Surgical Inc., Elliott Wave Technical Analysis
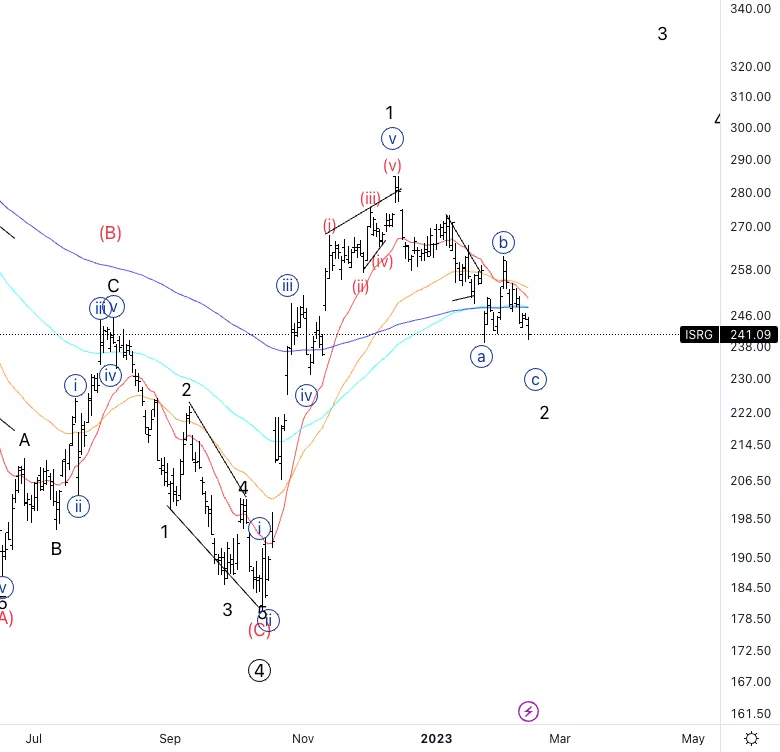
Intuitive Surgical Inc., (Nasdaq: ISRG): Daily Chart, 15 February 2023.
ISRG Stock Market Analysis: Looking for further downside into wave {c} as we have been anticipating for quite some weeks now, and then we’ll look for longs in wave 3.
ISRG Elliott Wave Count: Wave {c} of 2.
ISRG Technical Indicators: Below all averages.
ISRG Trading Strategy: Looking for a bottom in wave 2 to then look for longs.
Analyst: Alessio Barretta
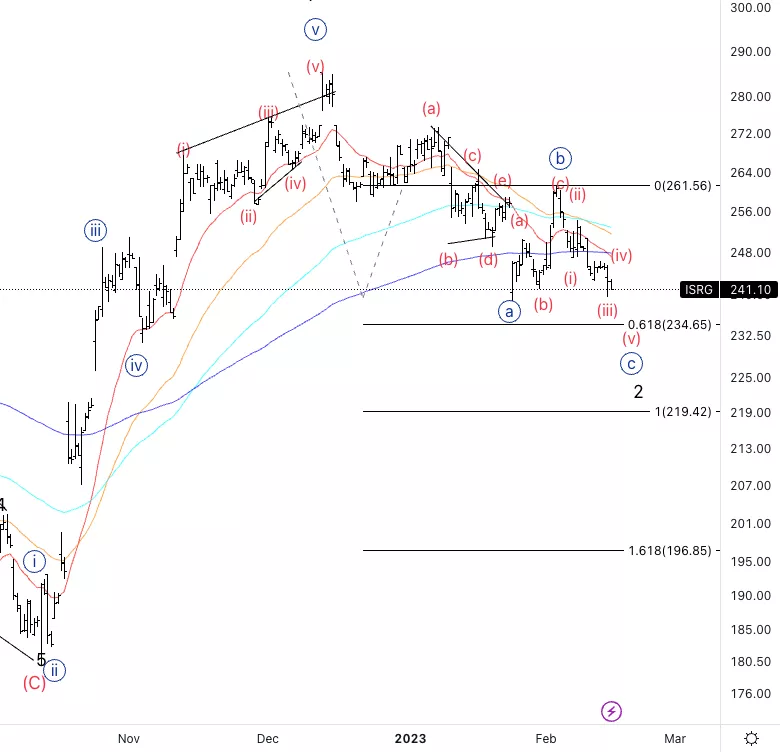
Intuitive Surgical Inc., ISRG:4-hour Chart, 15 February 2023.
Intuitive Surgical Inc., Elliott Wave Technical Analysis
ISRG Stock Market Analysis: Looking for further downside into wave {c} as we could be in wave (iv) of {c} and we could reach the 0.618 {c} vs. {a} to then find support.
ISRG Elliott Wave count: Wave (iv) of {c}.
ISRG Technical Indicators: Below all averages.
ISRG Trading Strategy: Looking for a bottom in wave 2 to then look for longs.
More By This Author:
Elliott Wave Technical Analysis: Bitcoin /U.S. Dollar, Wednesday, Feb. 15
Elliott Wave Technical Analysis: Cisco Systems Inc.
Elliott Wave Technical Analysis: Dogecoin / U.S. Dollar



Comments
Log in or sign up to join the conversation.