
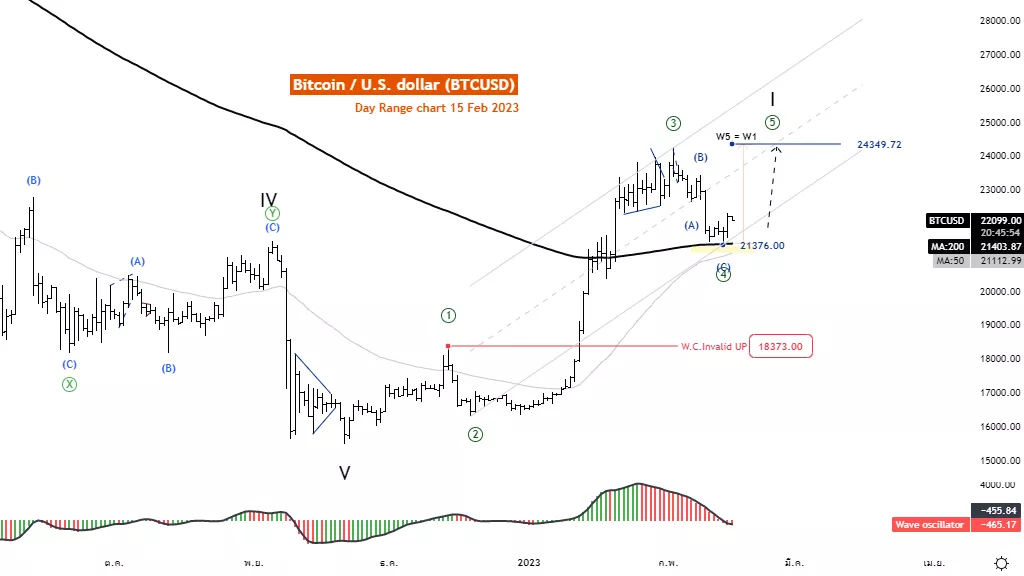
Elliott Wave Analysis TradingLounge Daily Chart, February 15, 2023

Bitcoin /U.S. Dollar (BITCOMP)
Elliott Wave Technical Analysis
Function: Follow trend
Mode: Motive
Structure: Impulse
Position: Wave ((5))
Direction Next higher Degrees: wave I of Motive
Details: Wave ((5)) equals wave ((1)) at 24400
Wave Cancel invalid level: 18475
Bitcoin /U.S. Dollar (BTCUSD) Trading Strategy: Bitcoin has recovered from the same MA200 level reversing wave 4, making the price more likely to rise in wave 5 that could lead to the 24349 level.
Bitcoin /U.S. Dollar(BTCUSD)Technical Indicators: The price is above the MA200 indicating an UpTrend. The wave oscillators Below Zero-Line momentum are bearish.
TradingLounge Analyst: Kittiampon Somboonsod
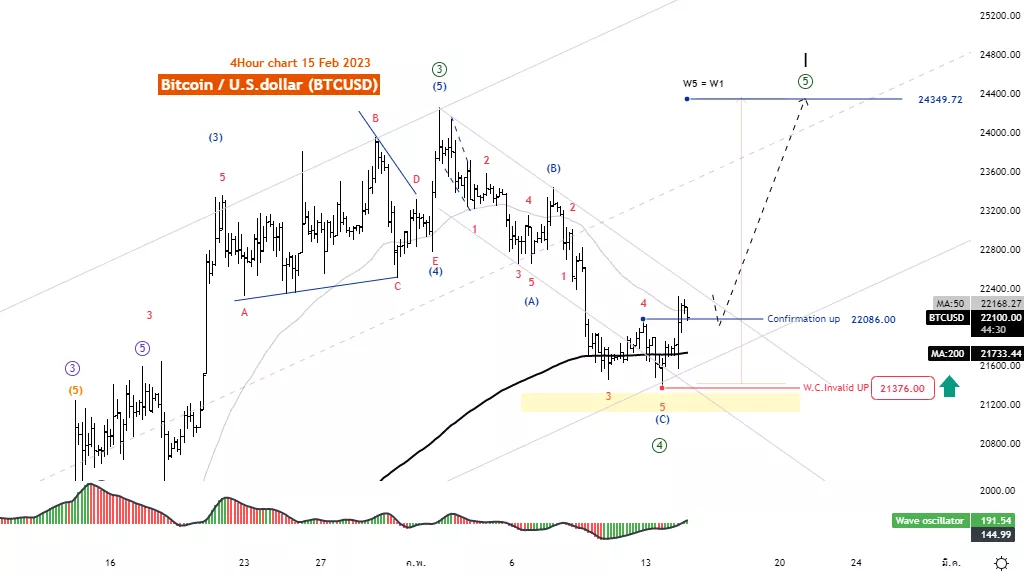
Elliott Wave Analysis TradingLounge 4H Chart, February 15, 2023
Bitcoin /U.S. Dollar (BTCUSD)
Elliott Wave Technical Analysis
Function: Follow trend
Mode: Motive
Structure: Impulse
Position: Wave ((5))
Direction Next higher Degrees: wave I of Motive
Details: Wave ((5)) equals wave ((1)) at 24400
Wave Cancel invalid level: 18475
Bitcoin /U.S. Dollar (BTCUSD) Trading Strategy: Bitcoin has recovered from the same MA200 level reversing wave 4, making the price more likely to rise in wave 5 that could lead to the 24349 level.
Bitcoin /U.S. Dollar (BTCUSD) Technical Indicators: The price is above the MA200 indicating an UpTrend. The wave oscillators above Zero-Line momentum are bullish.
More By This Author:
Elliott Wave Technical Analysis: Cisco Systems Inc.
Elliott Wave Technical Analysis: Dogecoin / U.S. Dollar
Elliott Wave Technical Analysis: Shopify, Monday, Feb. 13


Comments
Log in or sign up to join the conversation.