
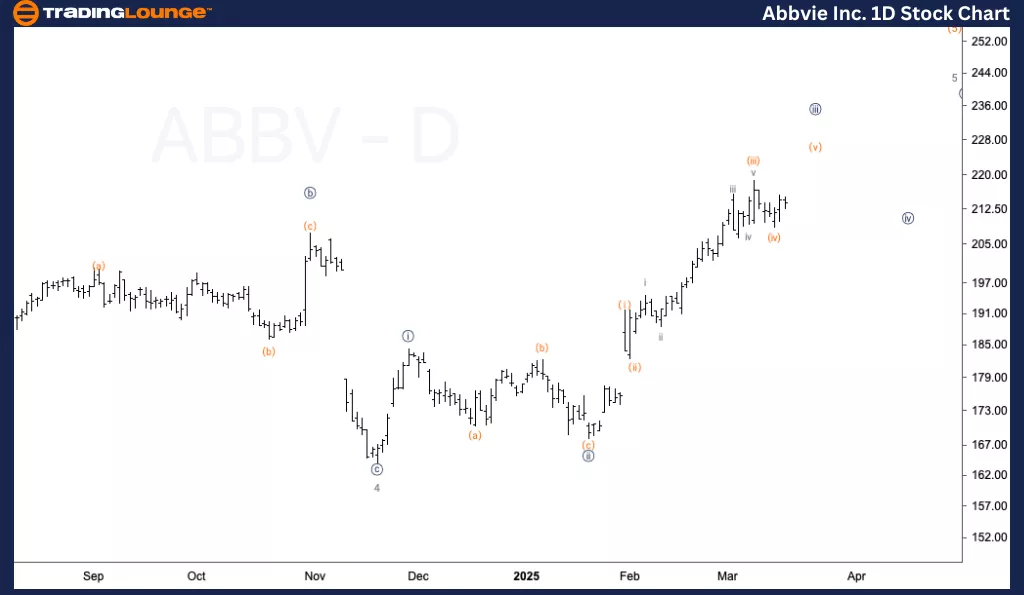
ABBV Elliott Wave Analysis – Trading Lounge Daily Chart
ABBV Elliott Wave Technical Analysis
Function: Trend
Mode: Impulsive
Structure: Motive
Position: Wave {iii} of 5
Direction: Upside in Wave {iii}
Details:
Looking for further upside to complete Minute Wave {iii}.
Potential upside target around $230, marking the completion of MG1.
A pullback in Wave {iv} is expected before resuming the overall trend.
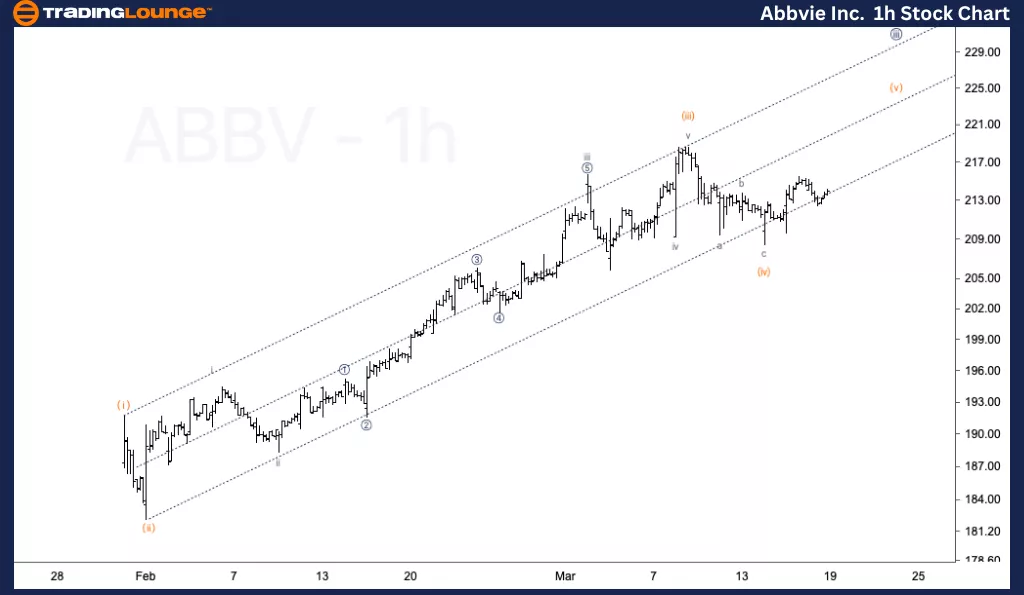
ABBV Elliott Wave Analysis – Trading Lounge 1H Chart
ABBV Elliott Wave Technical Analysis
Function: Trend
Mode: Impulsive
Structure: Motive
Position: Wave (v) of {iii}
Direction: Upside in Wave (v)
Details:
Observing a three-wave corrective move in Minuette Wave (iv).
There is a possibility that Wave (iv) has completed, and the stock is now resuming its upward move in Wave (v).
Further upside in Wave (v) will confirm the continuation of Wave {iii} towards higher targets.
Conclusion
This analysis provides a detailed Elliott Wave outlook for multiple equities, highlighting potential trend continuations and corrections. AbbVie (ABBV) is expected to continue its upward momentum towards $230, while other stocks such as CAT, CRM, CVX, and PANW are under corrective phases, awaiting confirmation of trend reversals or continuations.
Technical Analyst: Alessio Barretta
More By This Author:
Elliott Wave Technical Analysis: Block, Inc.
Elliott Wave Technical Analysis: U.S. Dollar/Swiss Franc - Wednesday, March 19
Elliott Wave Technical Analysis: Bitcoin Crypto Price - Wednesday, March 19


Comments
Log in or sign up to join the conversation.