
Elliott Wave Technical Analysis: Bitcoin Crypto Price - Wednesday, March 19
Elliott Wave Analysis TradingLounge Daily Chart
Bitcoin/ U.S. Dollar (BTCUSD)
BTCUSD Elliott Wave Technical Analysis
Function: Counter Trend
Mode: Corrective
Structure: Zigzag
Position: Wave b
Direction Next Higher Degree: Wave ((II))
Wave Cancel Invalid Level: Not specified
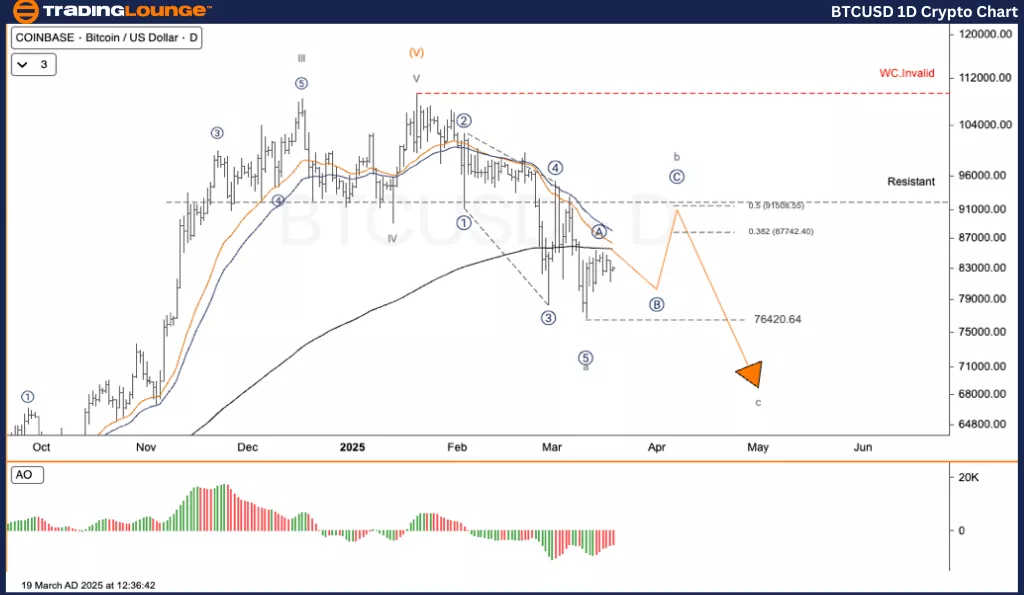
Details: Bitcoin (BTC/USD) is currently in an Elliott Wave corrective phase. The asset recently completed Wave A and is now likely entering Wave B. This phase represents a short-term recovery before Bitcoin resumes its downtrend towards Wave C.
Bitcoin/ U.S. Dollar (BTCUSD) Trading Strategy
Bitcoin (BTC/USD) continues to trade within an Elliott Wave corrective structure, having tested the $76,700 support level. The price action suggests an upward movement as part of Wave B, with the potential to test key resistance before further decline into Wave C.
The current correction follows an (a)-(b)-(c) pattern.
The recent low of $76,703 marked the end of Wave (a).
Wave (b) is now forming an uptrend.
The major resistance level is at $90,792, a key reversal point for Wave B before continuing downwards into Wave C.
Trading Strategies
Strategy
For Short-Term Traders (Swing Trade):
Bitcoin is expected to rebound toward the $90,000 – $91,000 resistance zone.
Short-term traders may find speculative opportunities in Wave B.
Risk Management
If Bitcoin approaches the $90,800 resistance, traders should watch for reversal signals to prepare for a potential strong Wave C downturn.
Elliott Wave Analysis TradingLounge H4 Chart
Bitcoin/ U.S. Dollar (BTCUSD)
BTCUSD Elliott Wave Technical Analysis
Function: Counter Trend
Mode: Corrective
Structure: Zigzag
Position: Wave b
Direction Next Higher Degree: Wave ((II))
Wave Cancel Invalid Level: Not specified
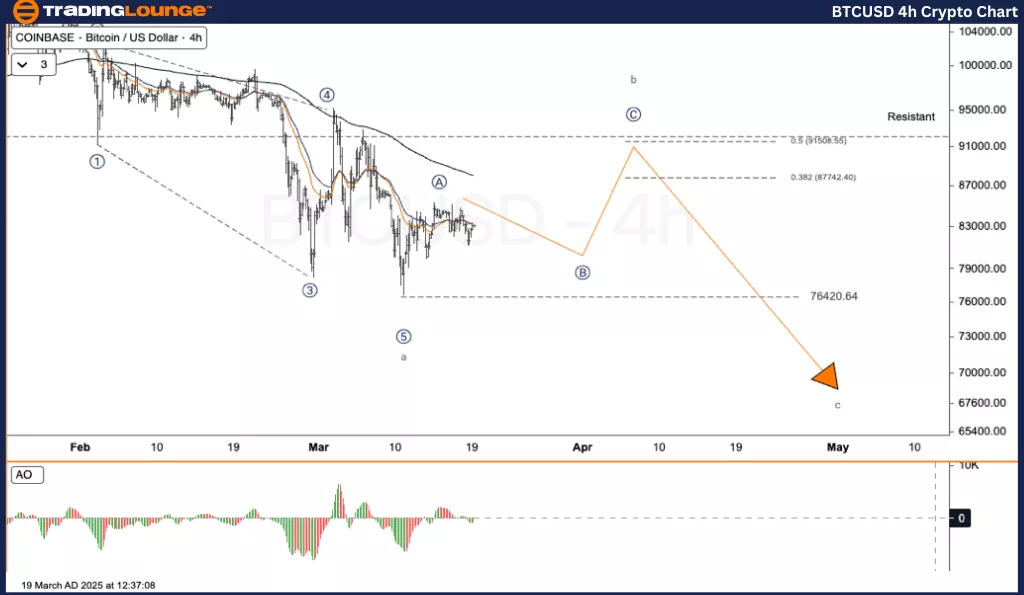
Details: Bitcoin (BTC/USD) remains in an Elliott Wave corrective structure. The price has recently completed Wave A and is now likely transitioning into Wave B, which represents a temporary bounce before continuing into Wave C.
Bitcoin/ U.S. Dollar (BTCUSD) Trading Strategy
Bitcoin is still trading within a corrective wave structure after dropping to the $76,700 support zone. The price has started a Wave B rebound, potentially testing resistance at $90,792, before reversing into Wave C.
The correction follows a (a)-(b)-(c) pattern.
The recent low of $76,703 marked the end of Wave (a).
The next major resistance is at $90,792, a possible reversal zone for Wave B before the price enters a downward Wave C.
Trading Strategies
Strategy
For Short-Term Traders (Swing Trade):
Bitcoin is expected to rebound to the $90,000 – $91,000 resistance level before declining again.
Short-term traders may find speculative opportunities during the Wave B movement.
Risk Management
If Bitcoin nears the $90,800 resistance, traders should monitor for potential reversal signals before a significant Wave C downtrend.
TradingLounge Analyst: Kittiampon Somboonsod, CEWA
More By This Author:
Elliott Wave Technical Analysis: ASX Limited - Tuesday, March 18
Elliott Wave Technical Analysis - Alibaba Group Holdings Ltd.
Elliott Wave Technical Analysis: British Pound/Australian Dollar - Tuesday, March 18
At TradingLounge™, we provide actionable Elliott Wave analysis across over 200 markets. Access live chat rooms, advanced AI & algorithmic charting tools, and curated trade ...
more

