
Elliott Wave Technical Analysis - Alibaba Group Holdings Ltd.
Alibaba Group Holdings Ltd. (BABA) Elliott Wave Analysis – Trading Lounge
Daily Chart Analysis
- Function: Trend
- Mode: Impulsive
- Structure: Motive
- Position: Wave (5) of C
- Direction: Upside within wave (5)
- Details:
- Alibaba is moving higher within wave (5) of Primary wave C, suggesting a long-term corrective phase retracing the 2021 decline.
- Resistance is expected around $168, where wave C could equal wave A.
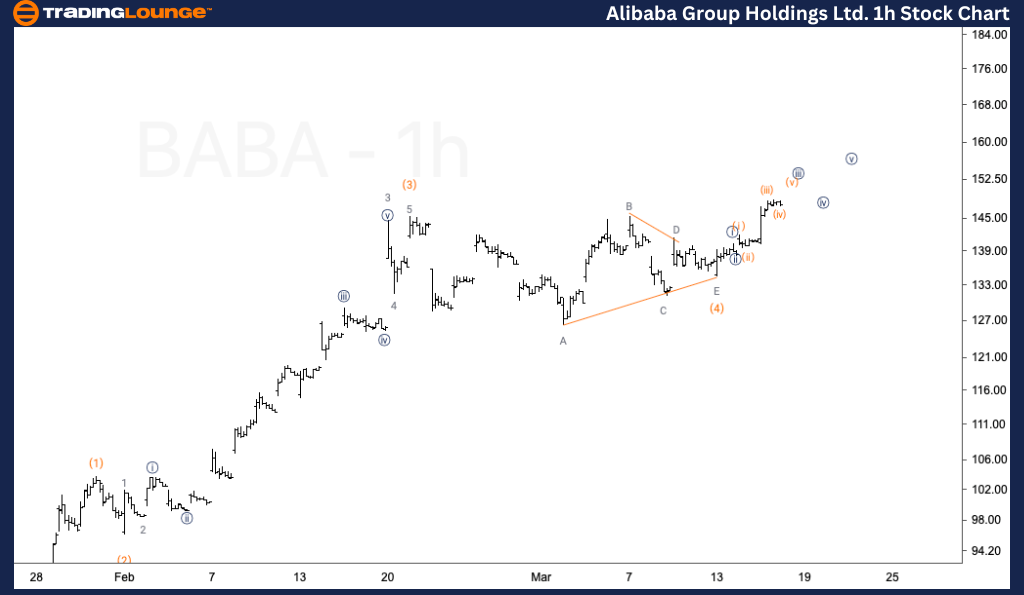
1-Hour Chart Analysis
- Function: Trend
- Mode: Impulsive
- Structure: Motive
- Position: Wave 1 of (5)
- Direction: Upside within wave (5)
- Details:
- Alibaba continues higher within wave (5), nearing completion of wave 1 of (5).
- A pullback in wave 2 is expected, providing an opportunity to assess whether the move is wave 1 of (5) or the completion of wave (5) itself.
- Upside potential may be limited as resistance approaches.
Conclusion
This Elliott Wave analysis evaluates trend structures across various equities, highlighting potential resistance and retracement levels. For Alibaba (BABA), the focus remains on wave (5), with a key resistance at $168 that could mark the end of the corrective rally.
Technical Analyst: Alessio Barretta
More By This Author:
Elliott Wave Technical Analysis: ASX Limited - Tuesday, March 18
Elliott Wave Technical Analysis: British Pound/Australian Dollar - Tuesday, March 18
VeChain Crypto Price Today
At TradingLounge™, we provide actionable Elliott Wave analysis across over 200 markets. Access live chat rooms, advanced AI & algorithmic charting tools, and curated trade ...
more

