
USDCHF Elliott Wave Analysis – Trading Lounge
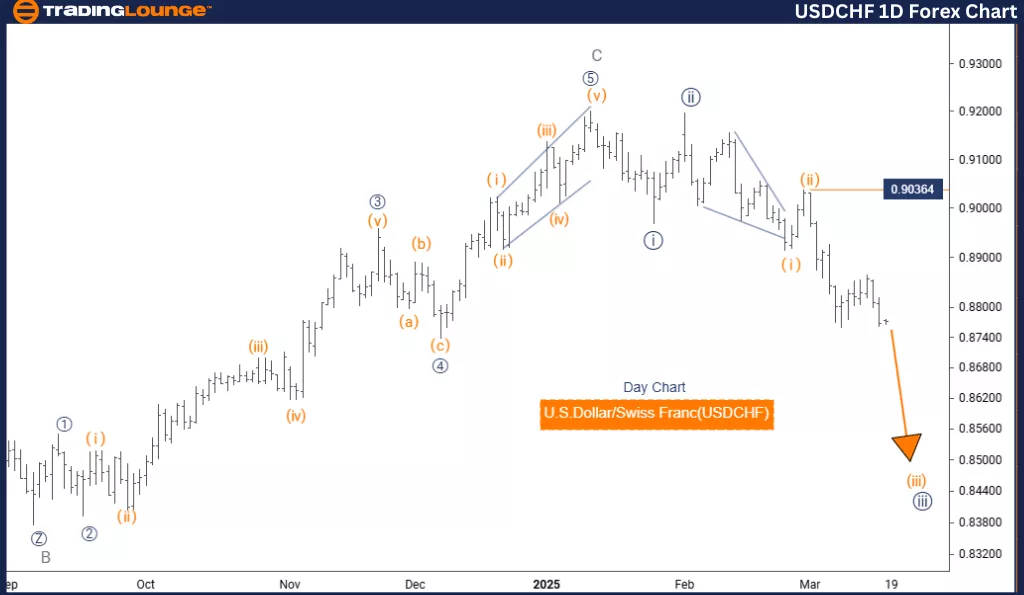
U.S. Dollar / Swiss Franc (USDCHF) Day Chart
USDCHF Elliott Wave Technical Analysis
Function: Bearish Trend
Mode: Impulsive
Structure: Orange Wave 3
Position: Navy Blue Wave 3
Direction Next Higher Degree: Orange Wave 4
Wave Cancel Invalidation Level: 0.90364
Analysis Overview
The USDCHF Elliott Wave Analysis for the daily chart provides a comprehensive assessment of the U.S. Dollar/Swiss Franc currency pair, focusing on its current trend and potential future price movements.
The market is currently in a bearish trend, driven by impulsive price movements rather than corrective ones.
The primary wave structure under consideration is Orange Wave 3, which is part of a larger wave pattern within Navy Blue Wave 3.
The analysis suggests that Orange Wave 2 has likely completed, with the market now transitioning into Orange Wave 3.
This wave is expected to be strong and directional before the emergence of the next significant trend.
The next higher-degree wave to monitor is Orange Wave 4, expected to develop after Orange Wave 3 concludes.
Key Levels & Trading Considerations
Invalidation Level: 0.90364
If the price moves beyond this level, the current wave count would be invalidated, indicating a potential shift in market dynamics.
Traders should monitor Orange Wave 3 closely and be prepared for the transition into Orange Wave 4.
Trading Insights
This daily chart analysis offers a structured approach to understanding the market’s movement, providing traders with key insights into trend progression.
Wave patterns and key levels play a critical role in making informed trading decisions.
Identifying wave completions and new trend formations helps traders anticipate future price shifts effectively.
By focusing on longer-term trends, traders can align their strategies with significant market movements and potential reversal points.
Conclusion
This Elliott Wave analysis of USDCHF presents a structured framework for interpreting price action, assisting traders in navigating the ongoing impulsive phase. By recognizing the importance of wave structures, key levels, and trend transitions, traders can better position themselves for anticipated market movements.
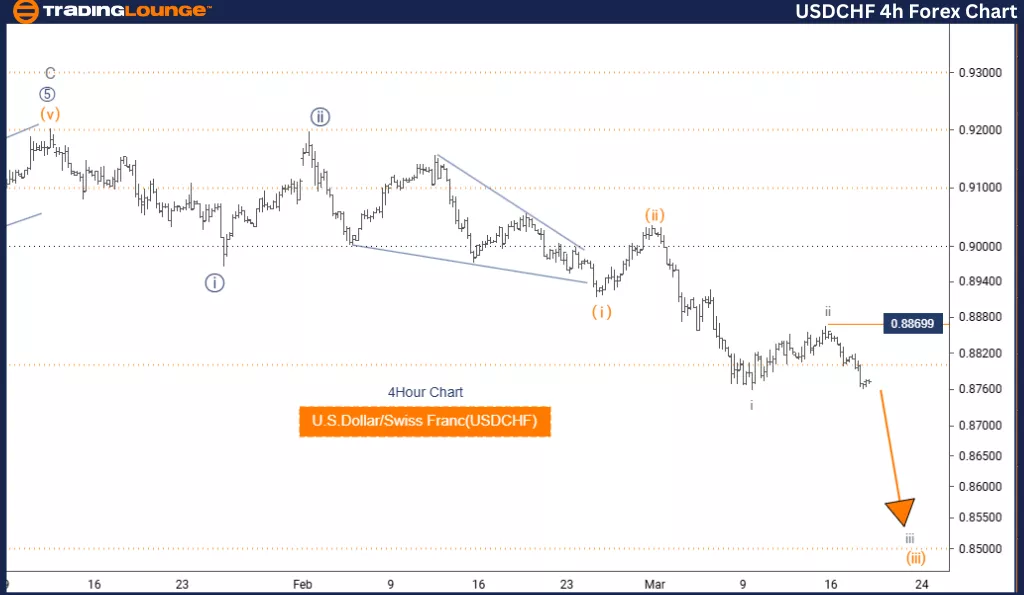
U.S. Dollar / Swiss Franc (USDCHF) 4-Hour Chart
USDCHF Elliott Wave Technical Analysis
Function: Bearish Trend
Mode: Impulsive
Structure: Gray Wave 3
Position: Orange Wave 3
Direction Next Lower Degree: Gray Wave 3 (Started)
Wave Cancel Invalidation Level: 0.90364
Analysis Overview
The USDCHF Elliott Wave Analysis for the 4-hour chart examines the U.S. Dollar/Swiss Franc currency pair, focusing on its current trend and future movements.
The market is currently in a bearish phase, characterized by impulsive price action rather than corrective movements.
The primary structure under consideration is Gray Wave 3, which is part of a larger wave formation within Orange Wave 3.
The analysis suggests that Gray Wave 2 has likely completed, and the market is now transitioning into Gray Wave 3.
This wave is expected to be strong and directional, pushing further downward before the next significant market move.
The next lower-degree wave to monitor is Gray Wave 3, which has already started and is anticipated to continue declining.
Key Levels & Trading Considerations
Invalidation Level: 0.90364
If the price moves above this level, the current wave count would be invalid, signaling a potential shift in market direction.
Traders should closely monitor Gray Wave 3 and prepare for further downward movement in line with the bearish trend.
Trading Insights
This 4-hour chart analysis offers a shorter-term perspective on market behavior, helping traders refine their strategies based on immediate price movements.
Understanding wave patterns and key levels is crucial for making well-informed trading decisions.
Identifying wave completions and new trend formations enables traders to anticipate market shifts accurately.
This approach ensures that traders are better prepared for evolving market conditions, allowing them to adjust their strategies accordingly.
Conclusion
This Elliott Wave analysis of USDCHF provides a structured framework for interpreting price action in a bearish market. By focusing on wave structures, key price levels, and trend transitions, traders can navigate the market with greater confidence.
Technical Analyst: Malik Awais
Source: Visit TradingLounge.com and learn from the experts.
More By This Author:
Elliott Wave Technical Analysis: Block, Inc.
Elliott Wave Technical Analysis: Bitcoin Crypto Price - Wednesday, March 19
Elliott Wave Technical Analysis: ASX Limited - Tuesday, March 18


Comments
Log in or sign up to join the conversation.