

Photo by Jakub Żerdzicki on Unsplash
What Is a Common Size Financial Statement?
Let’s kick things off with the basics. A common size financial statement is a version of a company’s financial report where each line item is expressed as a percentage of a base figure.
This approach makes it easier to compare companies of different sizes or to analyze trends within the same company over time. It’s a powerful tool for slicing through the noise and seeing what really matters in the numbers.
Understanding Common Size Financial Statements
Now, as someone who’s spent decades knee-deep in financial statements, I can tell you: context is everything. That’s where common size analysis shines.
By converting raw numbers into percentages, we can compare apples to apples, whether it’s across different companies or different periods.
For example, if you’re using the Fundamentals Analyzer software tool, you can instantly convert a balance sheet or income statement into a common size format. This lets you spot subtle shifts in cost structure, asset allocation, or profitability that might otherwise go unnoticed.
It’s not just about what the numbers are, but what they mean relative to the whole.
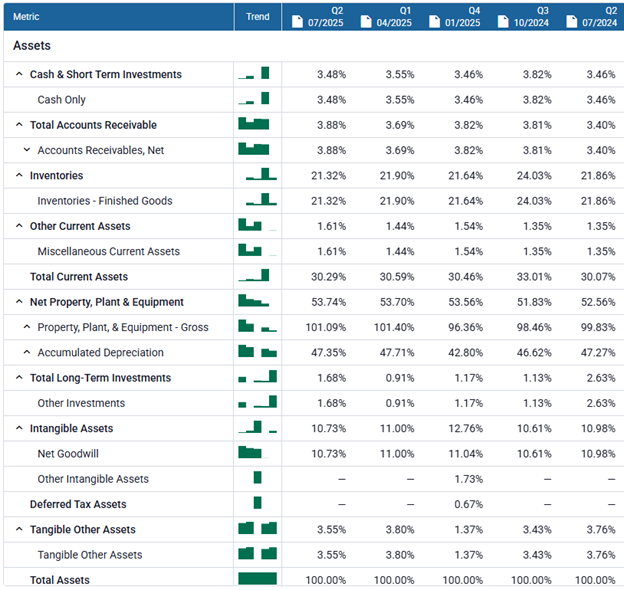
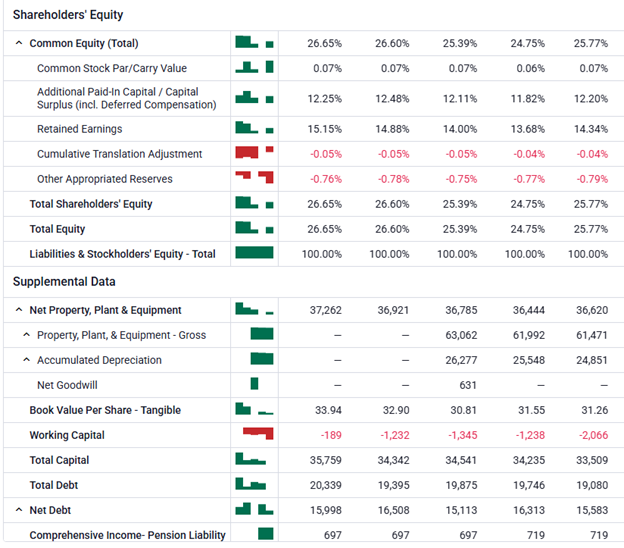
Common Size Balance Sheet Statement
When we talk about balance sheet common size analysis, we’re looking at each asset, liability, and equity item as a percentage of total assets.
This method, often called a common size analysis balance sheet, helps you see what proportion of assets are tied up in inventory versus cash, or how much of the company is financed by debt versus equity.
It’s a snapshot that reveals the company’s financial structure at a glance.
Below, we compare the behemoth Walmart to the much smaller competitor Target. Comparing a large company to a smaller competitor in the same industry is one of the most useful applications of common size financial statement analysis.
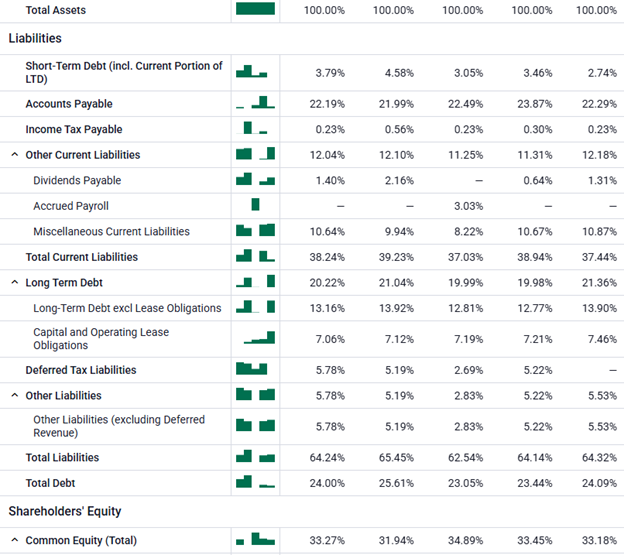
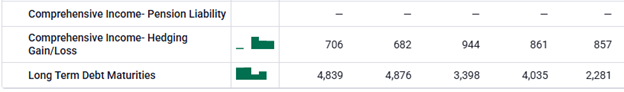
Walmart

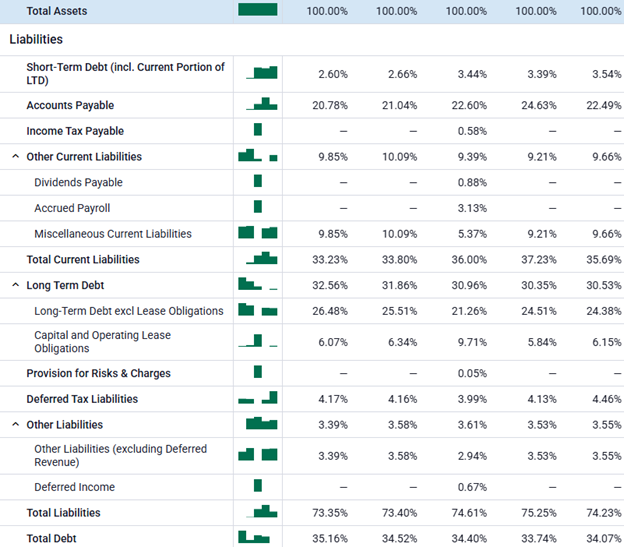
Target

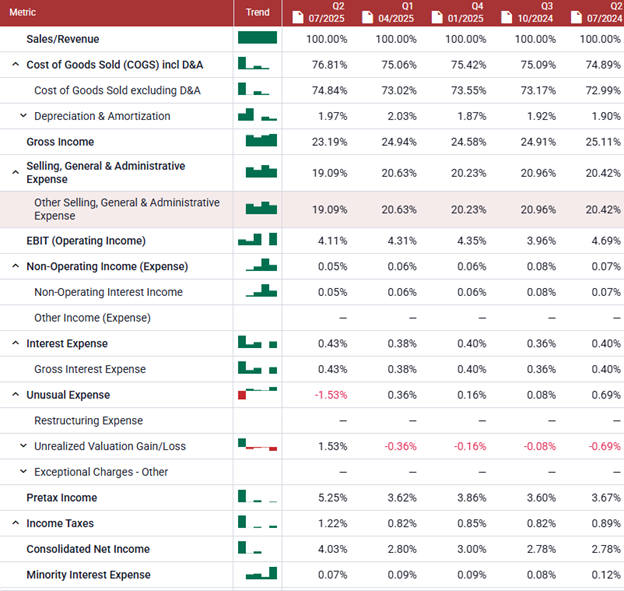
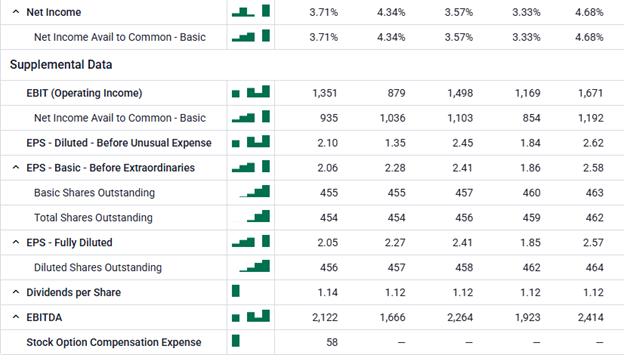
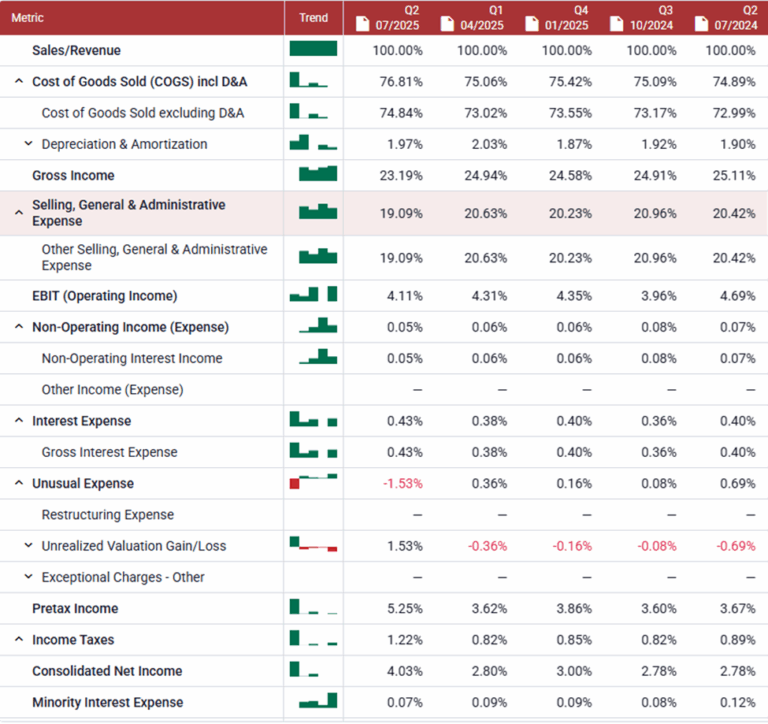
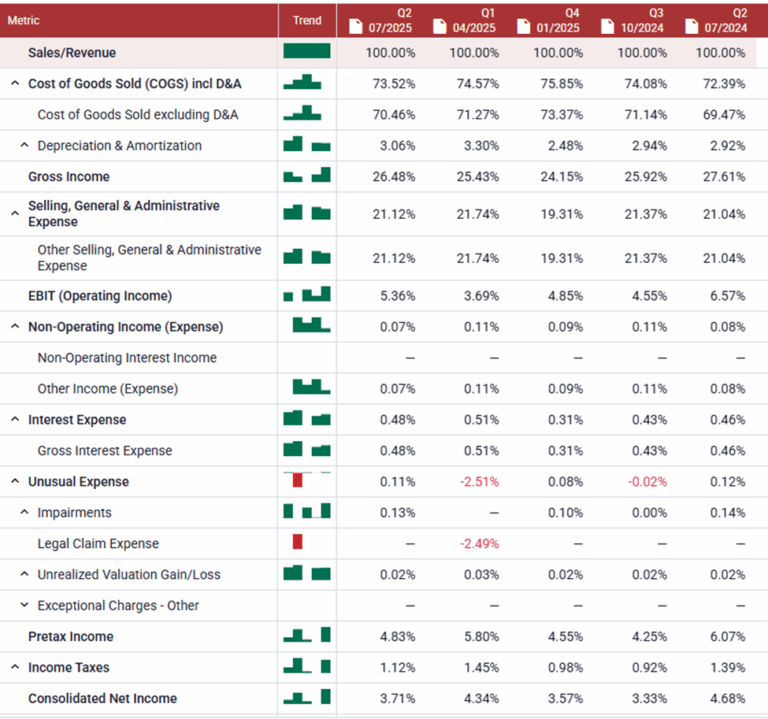
Common Size Income Statement
Ah, the common size income statement, my personal favorite.
Here, every line item (cost of goods sold, operating expenses, net income, etc.) is expressed as a percentage of total sales or revenue. This format is invaluable for analyzing profit margins, cost structures, and operational efficiency.
For instance, you can quickly see if rising sales are being eaten up by higher costs, or if the company is improving its bottom line.
Walmart
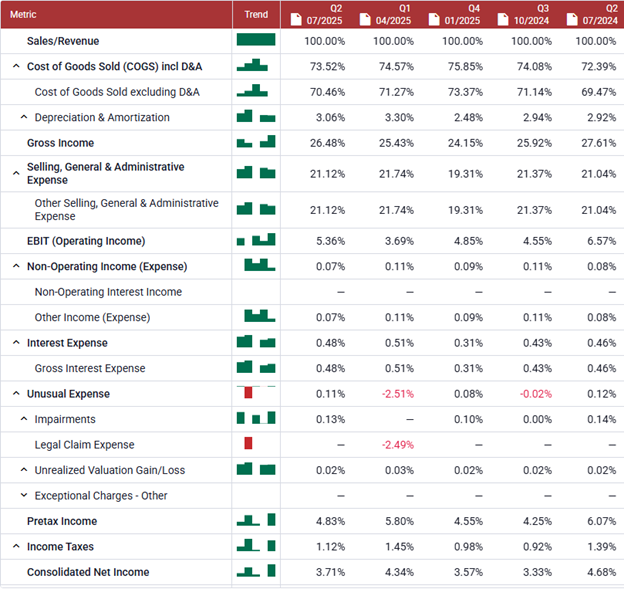
Target
Common-Size Statement of Profit and Loss Example
Let’s put theory into practice. Suppose a company has $1,000,000 in sales, $600,000 in cost of goods sold, and $200,000 in operating expenses.
In a common size statement of profit and loss, cost of goods sold would be 60% of sales, and operating expenses would be 20%. If net income is $100,000, that’s 10% of sales.
This layout makes it easy to compare companies or track changes over time, regardless of their absolute size.
Walmart
Target
Common Size Cash Flow Statement
While less common than income statements or balance sheets, a common size cash flow statement can be just as insightful.
Here, each cash flow item, operating, investing, and financing, is shown as a percentage of total cash inflows or outflows. This helps you understand where the company’s cash is coming from and where it’s going, making it easier to spot trends in liquidity and capital allocation.
However, a common size cash flow statement is not used as extensively as a common size balance sheet or income statement.
Comparison With Regular Financial Statements
Traditional financial statements give you the raw numbers, great for detail, but not always for perspective.
Common size financial statements strip away the scale and focus on proportions. This is especially useful when comparing companies of different sizes or analyzing a single company’s performance over time.
For example, two companies might have vastly different revenues, but their cost structures could be nearly identical when viewed as percentages.
This approach also helps highlight outliers or red flags that might be buried in the raw data.
Conclusion
In my years of valuation work, I’ve found common size analysis to be one of the most effective ways to cut through complexity and get to the heart of a company’s financial health.
Whether you’re using the Fundamentals Analyzer software tool or crunching numbers by hand, this technique brings clarity and comparability to your analysis.
It’s a must-have in any serious investor’s toolkit.
More By This Author:
Not All Price Drops Are The Same
Fundamental Analysis: Principles, Types, And How To Use It
What Is Stock Valuation?


Comments
Log in or sign up to join the conversation.