

Image Source: Unsplash
Watch the free-preview video below extracted from the WLGC session before the market opens on 30 Jul 2024 to find out the following:
- How to spot the tell-tale signs of weakness in the S&P 500 based on past analogs.
- The top 2 indicators to identify the increase in the bearish momentum.
- The downside target for the S&P 500.
- And a lot more...
Video Length: 00:06:42
Market Environment
The bullish vs. bearish setup is 583 to 59 from the screenshot of my stock screener below.
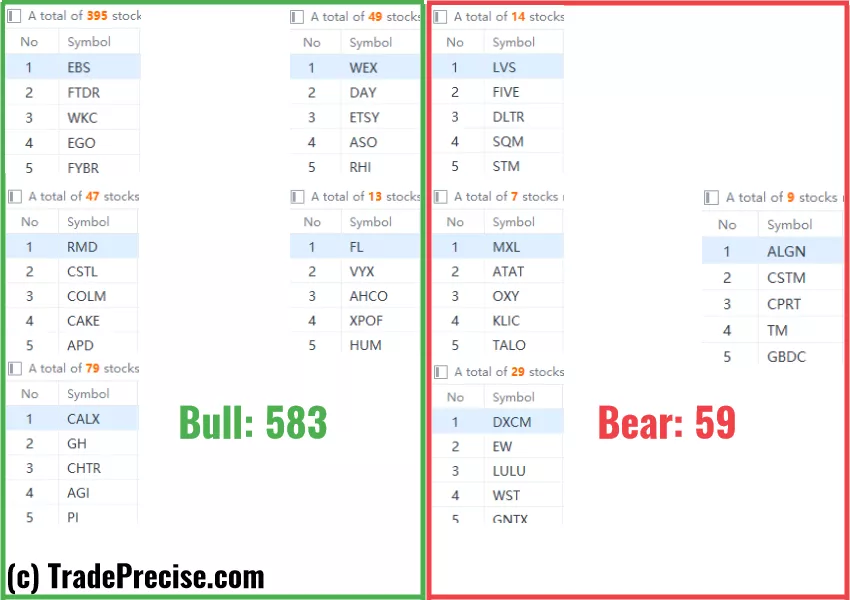
Although there is no shortage of bullish setups, the current rotation from the Nasdaq 100 (and S&P 500) into the Russell 2000 stirred up volatility.
Many breakout setups do not have immediate follow-through to the upside. More time is needed for supply absorption.
3 Stocks Ready To Soar
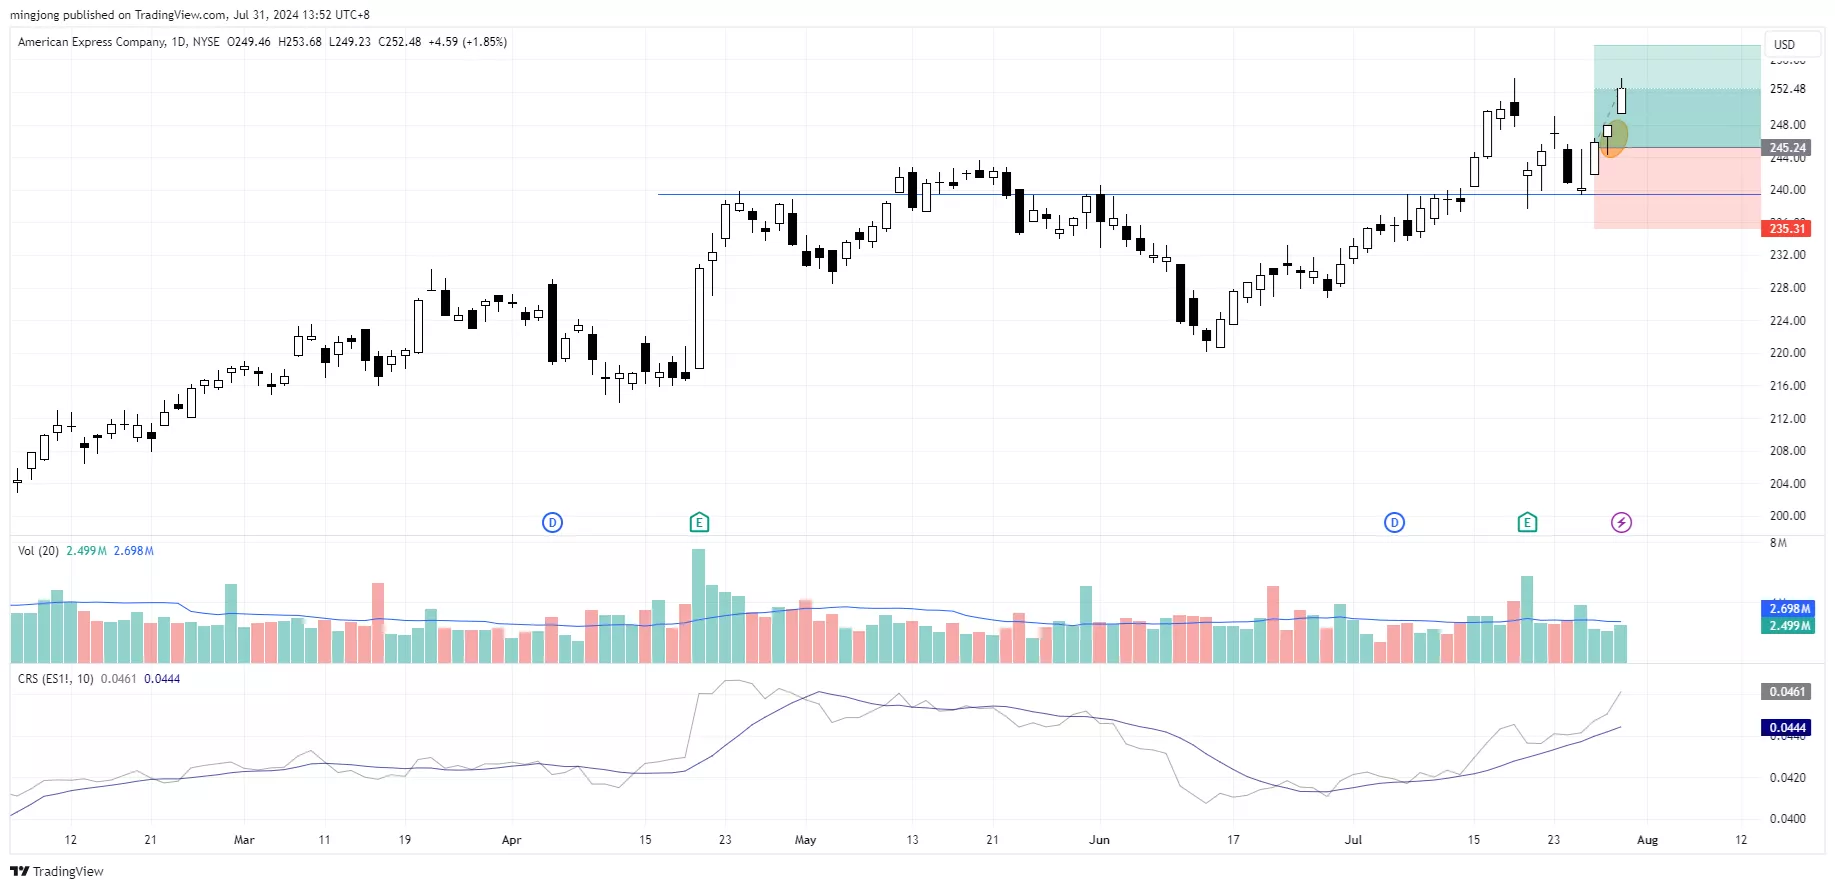
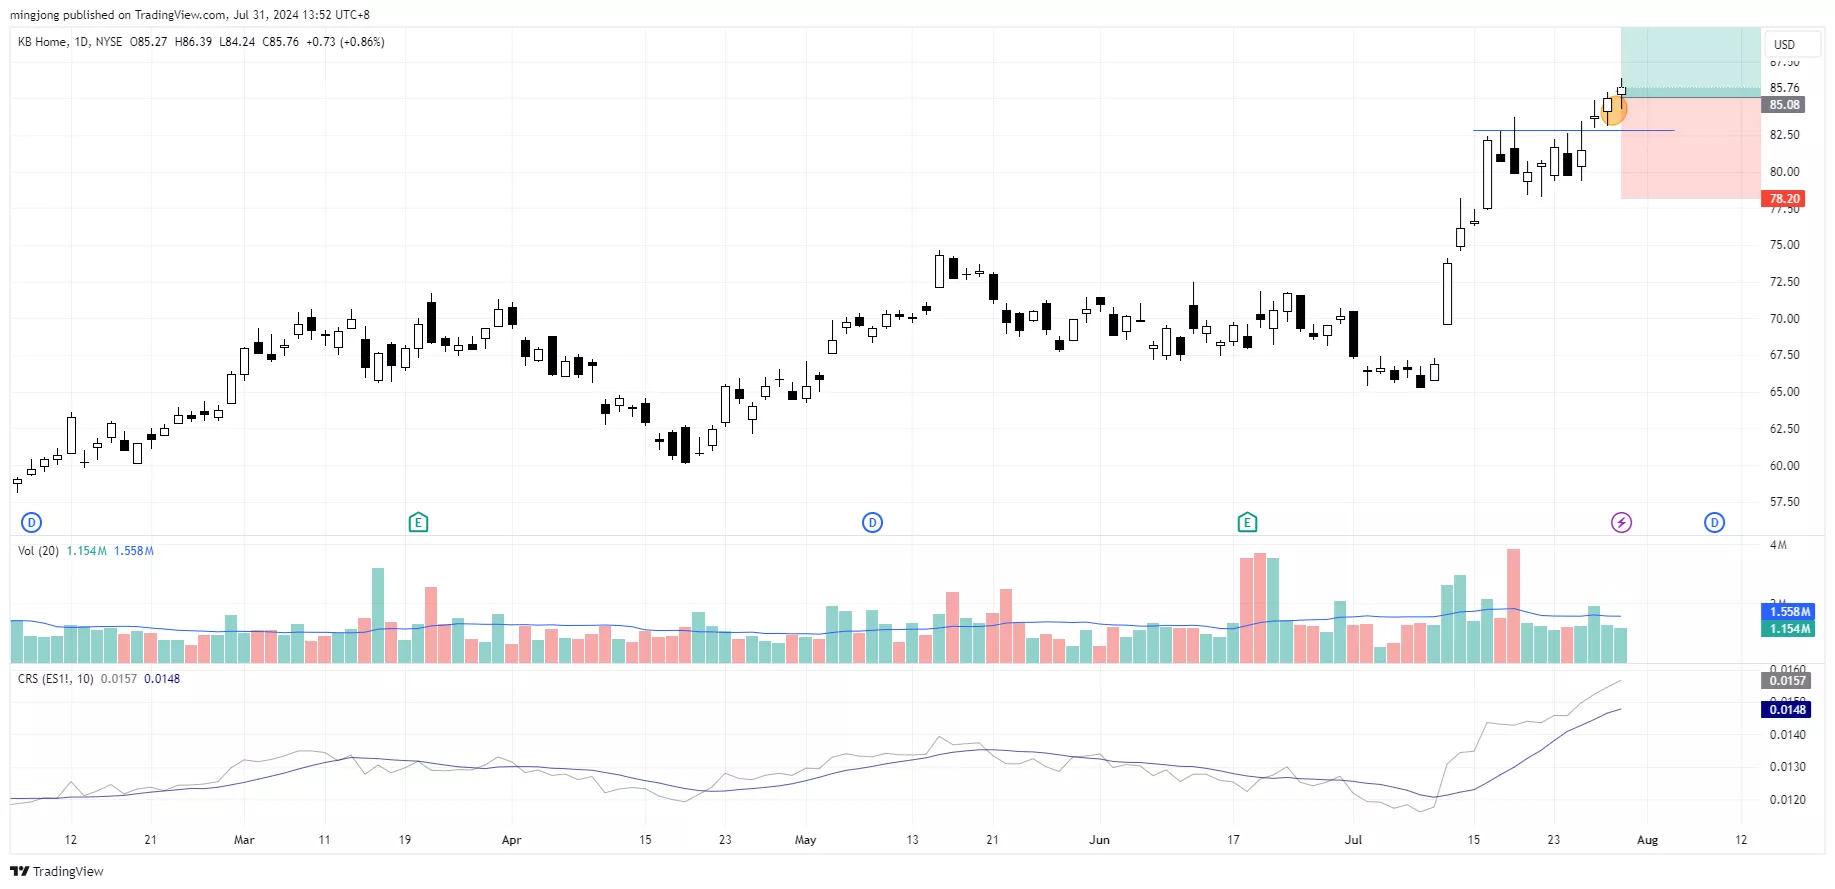
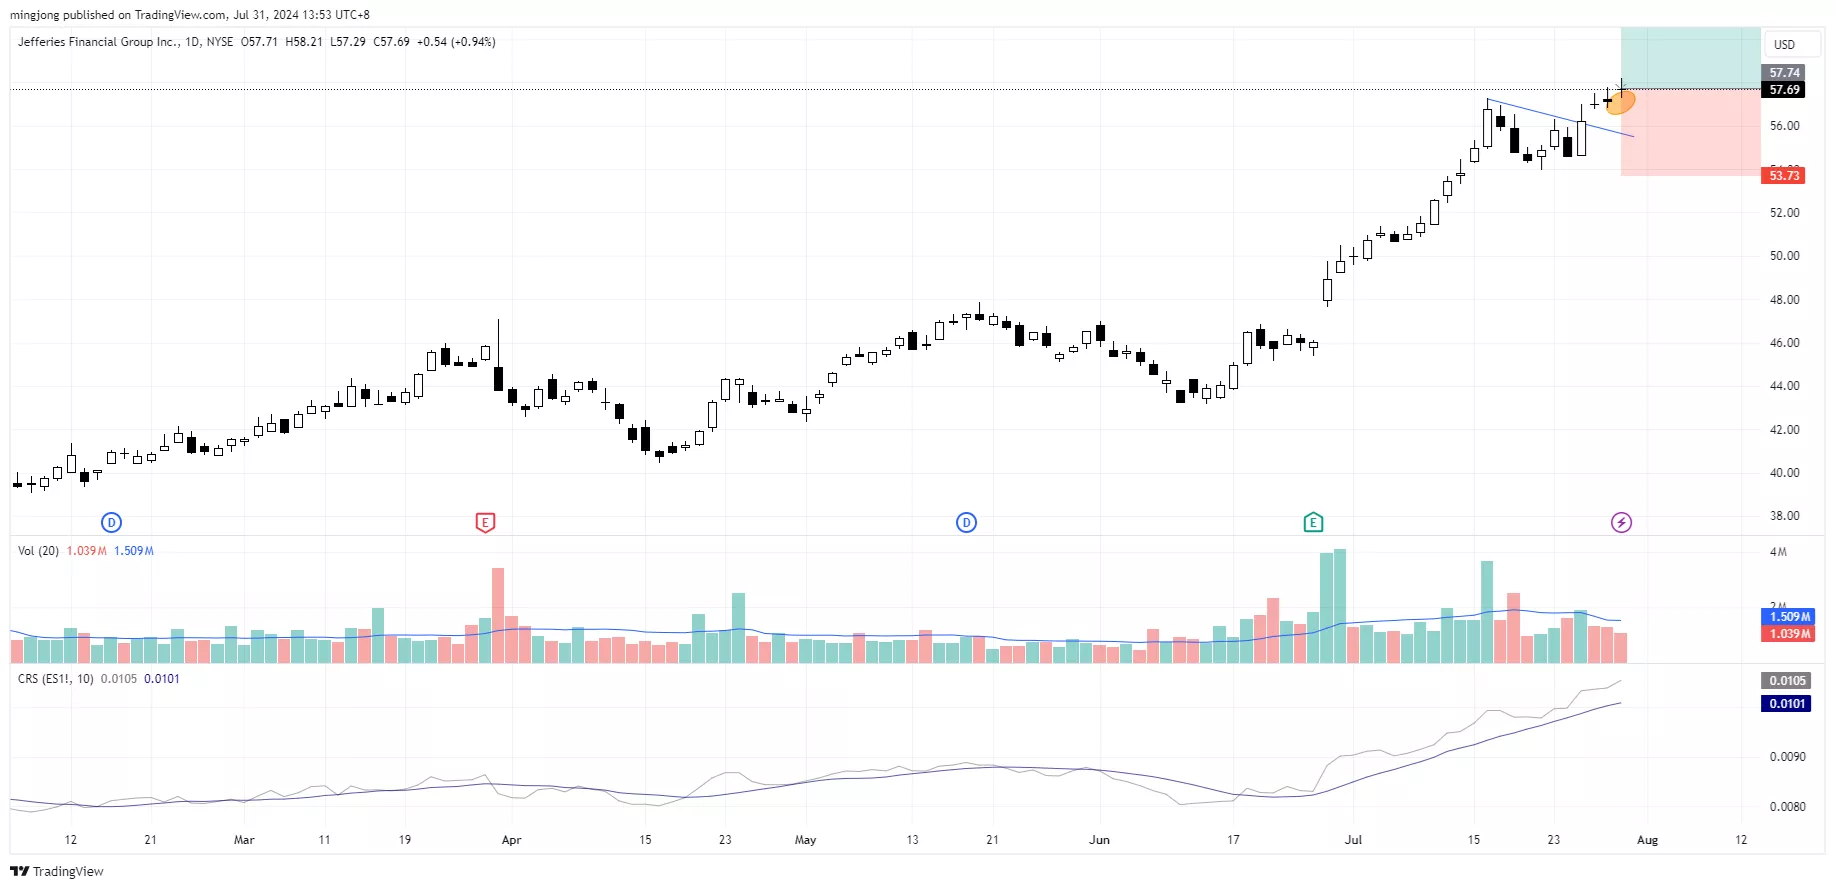
7 “earning reactions” AXP setups, 3 “low-hanging fruits” KBH trade entries setups + 7 actionable setups JEF were discussed during the live session before the market open (BMO).
(Click on image to enlarge)
(Click on image to enlarge)
(Click on image to enlarge)
More By This Author:
Will The Nasdaq 100's Relief Rally Hold Or Is A Sharp Decline Inevitable?
How The Hidden Signs Of Selling Into Strength Could Shake The S&P 500
Low Volume Flag Breakout! What’s Next For S&P 500?


Comments
Log in or sign up to join the conversation.