

Image Source: Pixabay
Watch the free-preview video below extracted from the WLGC session before the market opens on 17 Jul 2024 to find out the following:
- The simplest way to spot a market rotation.
- The analogues to adopt to anticipate the market correction
- Why the change of character bar on last Thursday signals a shift in the market?
- And a lot more...
Video Length: 00:05:37
Market Environment
The bullish vs. bearish setup is 661 to 25 from the screenshot of my stock screener below.
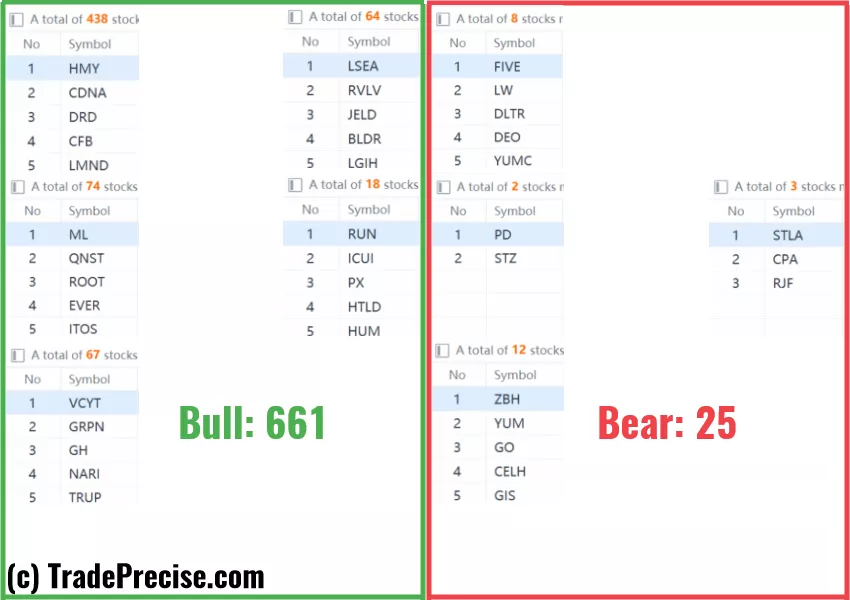
There is a clear rotation from Nasdaq 100 and the S&P 500 into the Russell 2000 (& the Dow Jones) since 11 Jul 2024 (Thursday).
This is further confirmed by the significant improvement in both the number of the bullish setups and market breadth.
A pullback or consolidation could provide a great opportunity for re-accumulation. Now again is the best time to identify the next batch of leaders (like KRE).
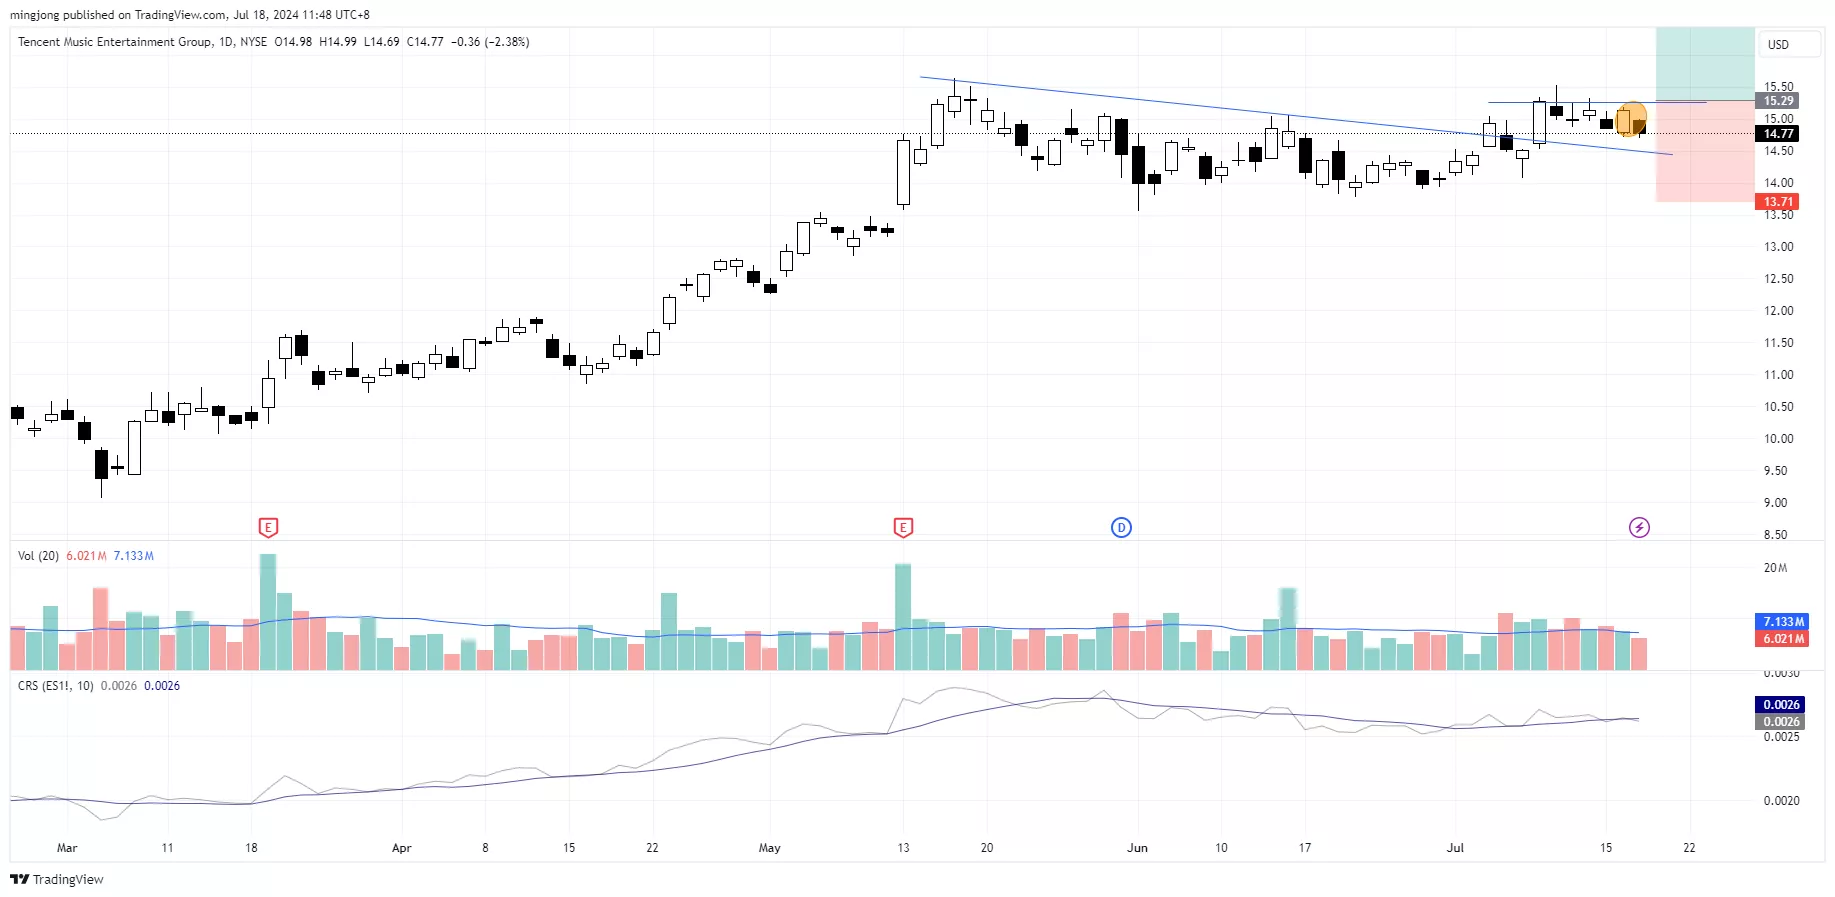
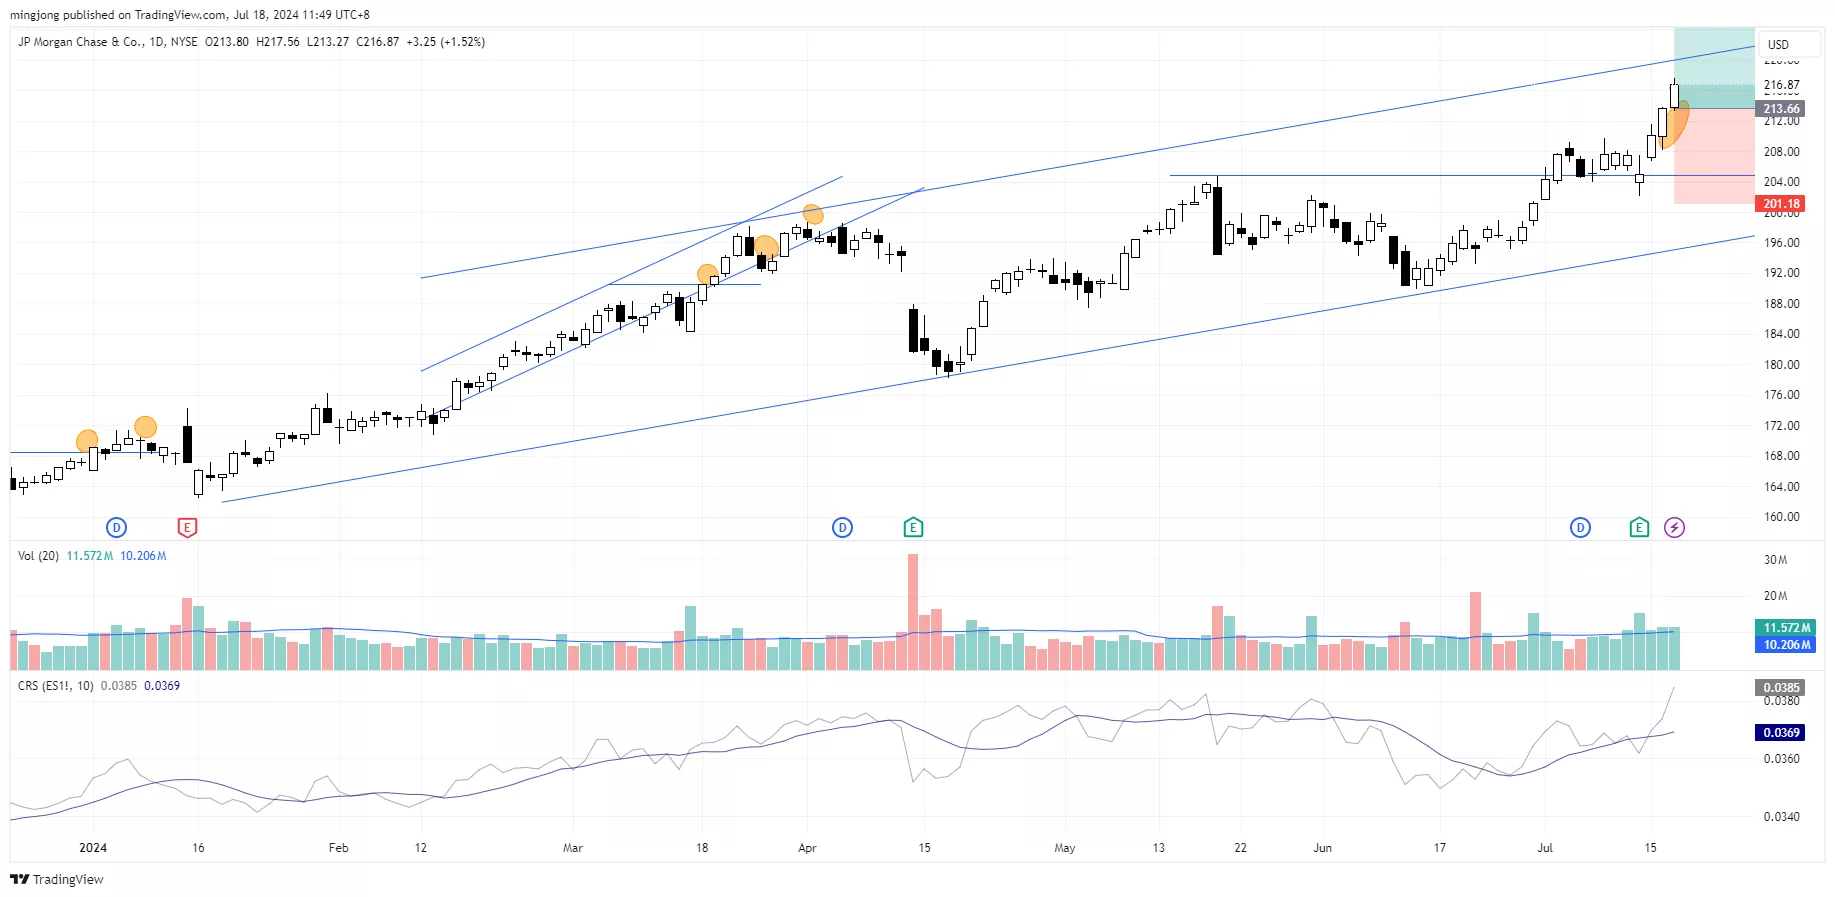
3 Stocks Ready To Soar
5 “low-hanging fruits” trade entries setups KD, TME + 19 actionable setups JPM were discussed during the live session before the market open (BMO).
(Click on image to enlarge)
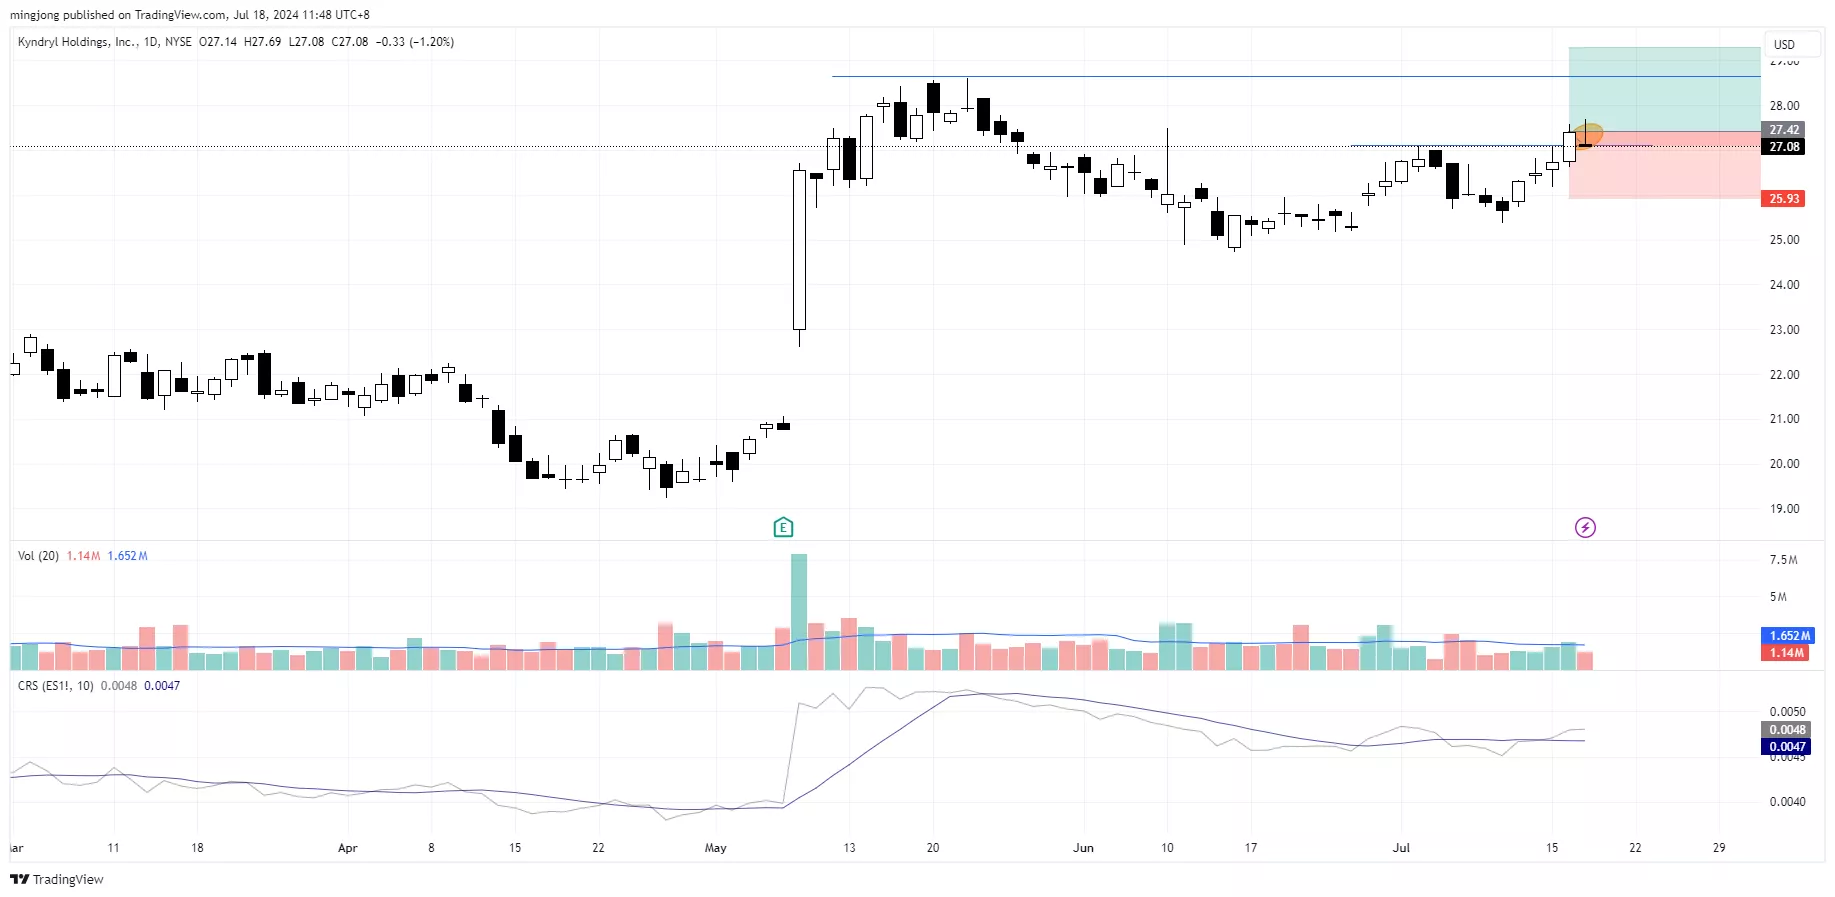
(Click on image to enlarge)
(Click on image to enlarge)
More By This Author:
Low Volume Flag Breakout! What’s Next For S&P 500?
Could This Be The Turning Point? The S&P 500's Next Big Move Explained
Nasdaq 100 Overbought? Here’s What History Says About The Current Rally


Comments
Log in or sign up to join the conversation.