
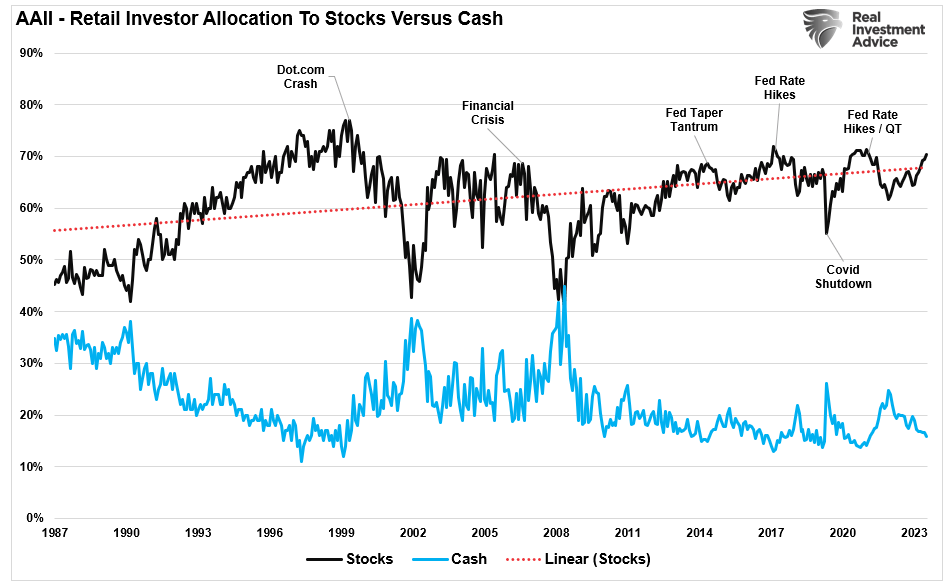
Are the “Mega-Cap” stocks dead? Maybe. But there are four reasons why they could be staged for a comeback. The recent market correction from the July peak certainly got investors’ attention and rattled the more extreme complacency. As we noted previously:
“While there have certainly been more extended periods in the market without a 2% decline, it is essential to remember that low volatility represents a high “complacency” with investors. In other words, the longer the market moves higher without a significant correction, the more confident investors become. They respond by raising their allocations to equities (risk) and reducing their allocations to cash (safety).”
(Click on image to enlarge)
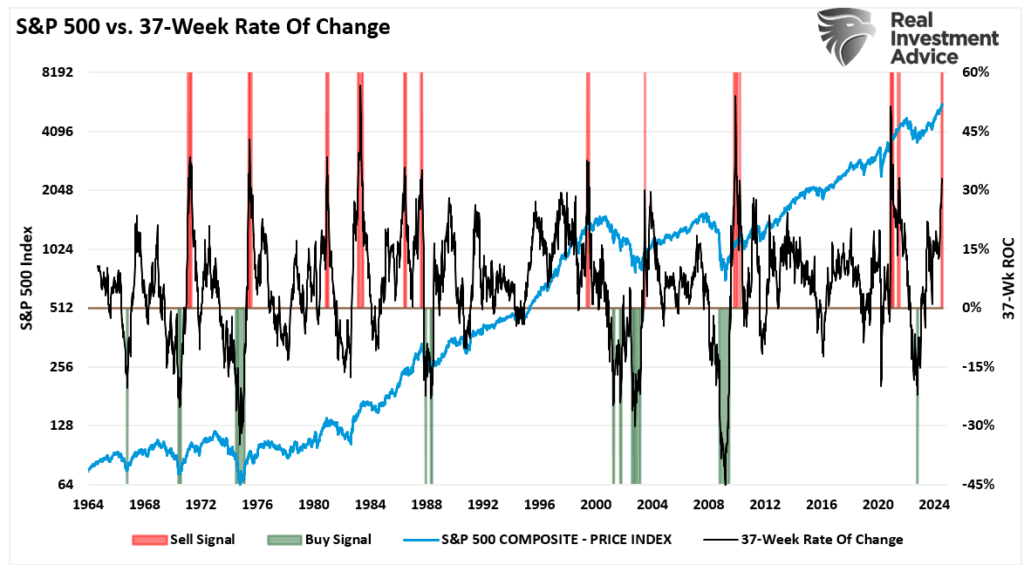
As repeatedly discussed in June and July, a 5-10% correction is normal and occurs almost yearly.
“Historically, when the 37-week rate of change is greater than 30%, such events typically precede short—to intermediate-term corrections. While the bulls are very confident, the risk of a 5% to 10% correction over the next three months remains elevated.” – July 13th
(Click on image to enlarge)
Unsurprisingly, retail and professional investors have witnessed a more extreme amount of selling of large-cap positioning over the last three weeks.
“The level of de-grossing by some strategies, alongside the correlated drawdowns in alpha / crowding performance, suggests that we could be mostly done with the drawdown and de-grossing. However, performance/alpha/gross flows could remain choppy over the next few months.” – John Schlegel, JPM
(Click on image to enlarge)

As John notes, the question is whether the correction process is over and whether investors will return to the “mega-caps” in their portfolios.
4-Reasons Mega-Caps Are Not Dead Yet
The recent sell-off in “Mega-cap” stocks, in particular, is unsurprising. We have warned about investors crowding into relatively few stocks to chase market returns.
“The bifurcation between the top 10 companies, as measured by market capitalization, and the other 490 stocks in the index has created an illusion of market bullishness. Despite the extremely crowded trade into the three sectors comprised of those ten stocks, we continue to see professional investors crowd into those shares at a record clip.”
There are four (4) reasons why investors, both professional and retail, were chasing a handful of stocks. They are also the same reasons that “Mega-caps” will likely regain their favor.
First, these stocks are highly liquid, and managers can quickly move money into and out without significant price movements. The importance of liquidity cannot be overlooked for insurance companies, pensions, hedge funds, and endowments. These investors must move millions of dollars at a time, and small companies are not liquid enough for sizeable inflows and outflows.
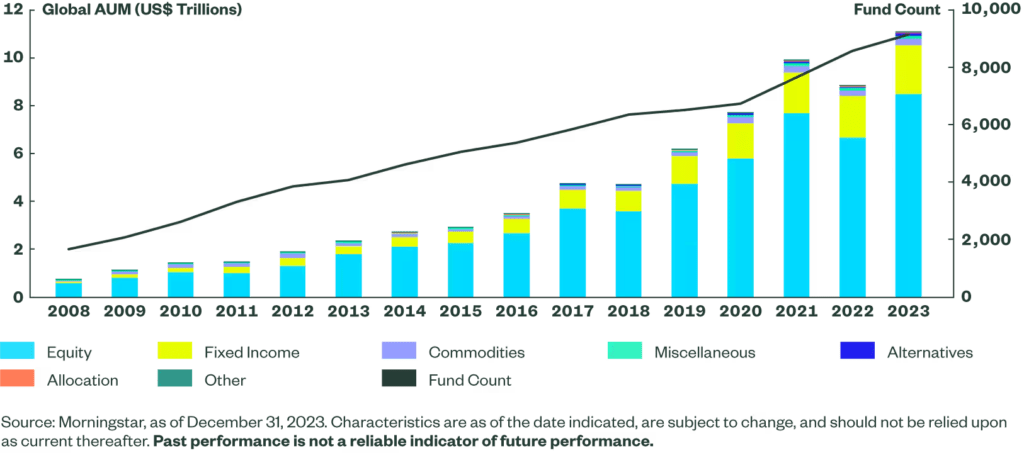
Secondly, the passive indexing effect has not gone away. As investors change their investing habits from buying individual stocks to the ease of purchasing a broad index, capital inflows unequally shift into the largest capitalization stocks in the index. Over the last decade, capital inflows into exchange-traded funds (ETFs) have exploded.
(Click on image to enlarge)
As we discussed in “Career Risk,”
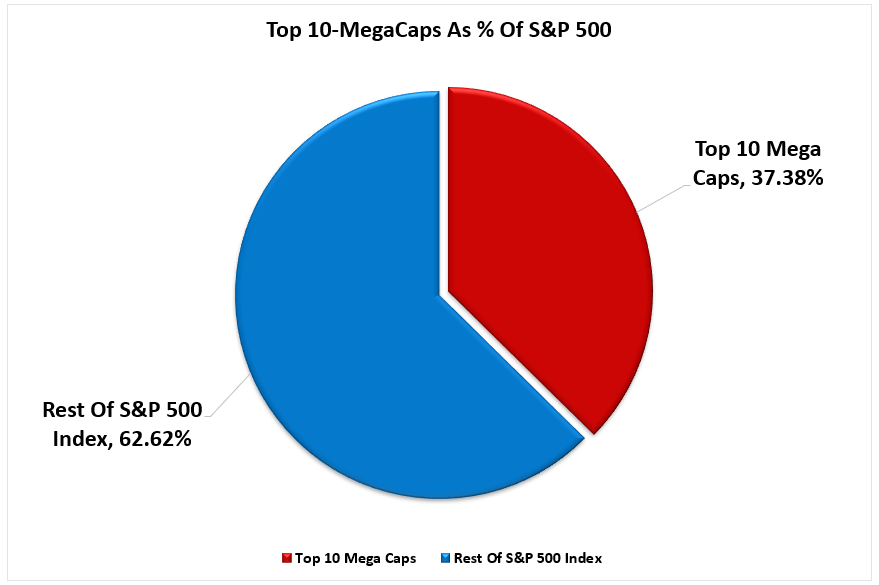
“The top-10 stocks in the S&P 500 index comprise more than 1/3rd of the index. In other words, a 1% gain in the top-10 stocks is the same as a 1% gain in the bottom 90%. As investors buy shares of a passive ETF, the shares of all the underlying companies must get purchased.“
(Click on image to enlarge)
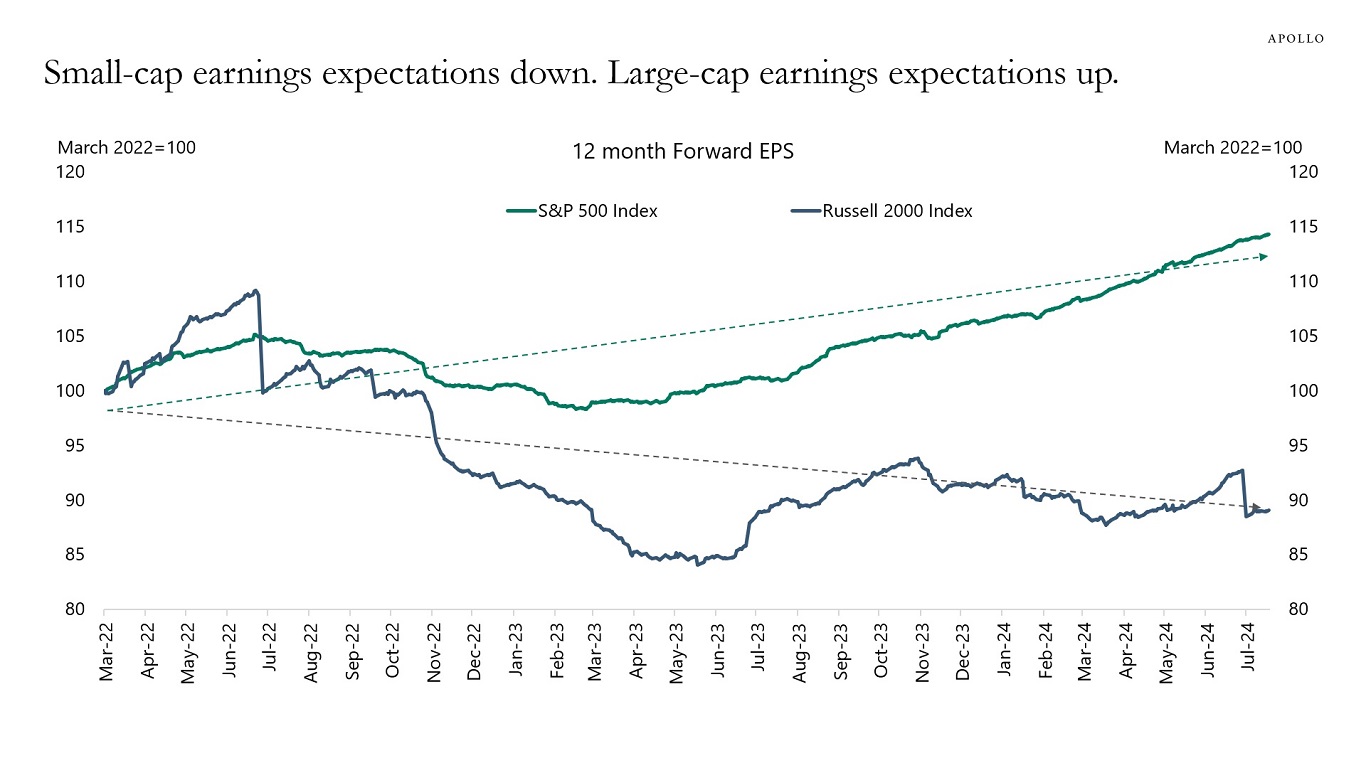
Third, the “Mega-cap” companies have more substantial earnings growth than their small—and mid-cap brethren. For now, the large-cap, primarily the “Mega-Cap” companies, are driving most of the earnings growth. With the economy showing clear signs of deterioration, earnings of small and mid-cap companies remain the most vulnerable to changes in economic demand.
(Click on image to enlarge)
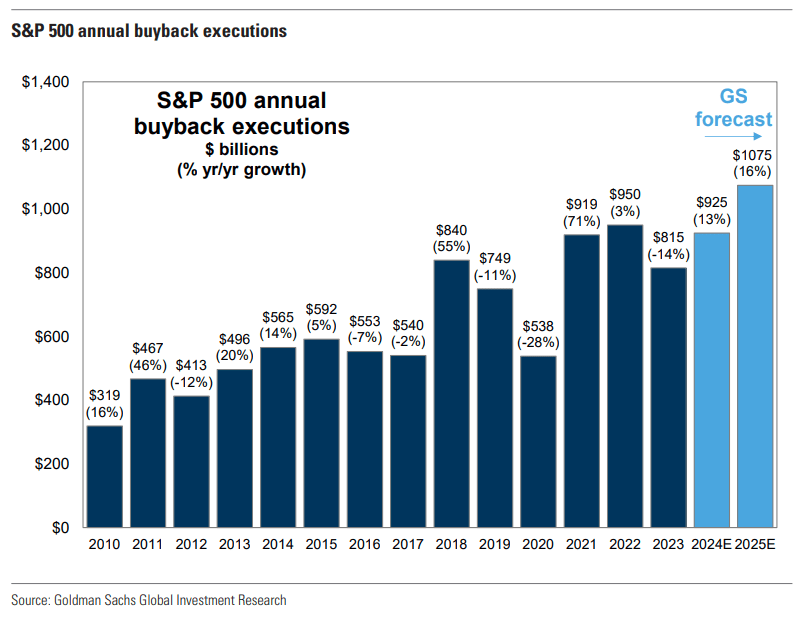
Lastly, and probably most importantly, large-cap, predominantly “Mega-cap” companies engage in share repurchases much more than small and mid-caps. Corporate share buybacks will approach $1 trillion this year and exceed that in 2025, with Apple alone accounting for more than 10% of those purchases.
(Click on image to enlarge)
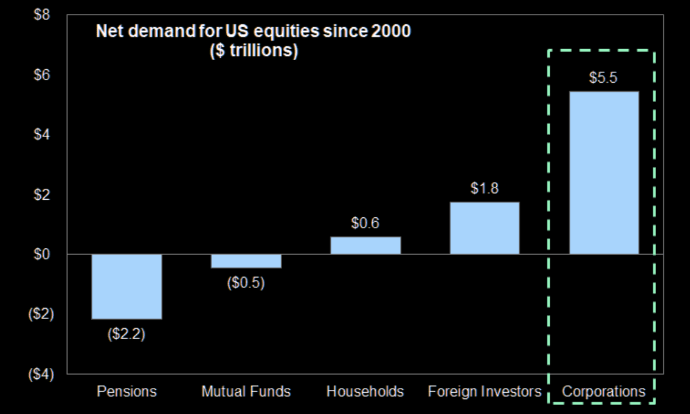
As we noted previously, this is not an insignificant factor supporting the rise in asset prices. Since 2000, corporate share buybacks have provided 100% of all the “net equity purchases.”
(Click on image to enlarge)
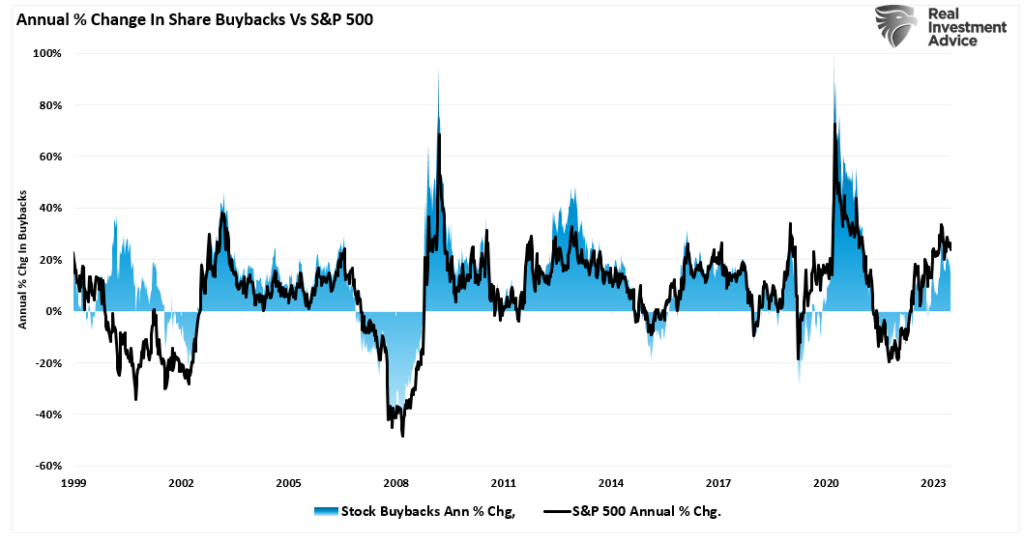
Therefore, it should be unsurprising that there is a high correlation between the ebbs and flows of corporate share buybacks and market performance.
(Click on image to enlarge)
With earnings season mostly behind us, the “buyback window” for the largest companies is now open. Such will allow the “Mega-caps” to start repurchasing shares.
However, while the support for the “Mega-caps” remains, the current correction process is likely incomplete.
Correction Is Likely Not Over Yet
So are “Mega-Caps” likely becoming a “mega-buy?” That may be stretching it a bit, but what is likely is that the recent underperformance is likely near its conclusion.
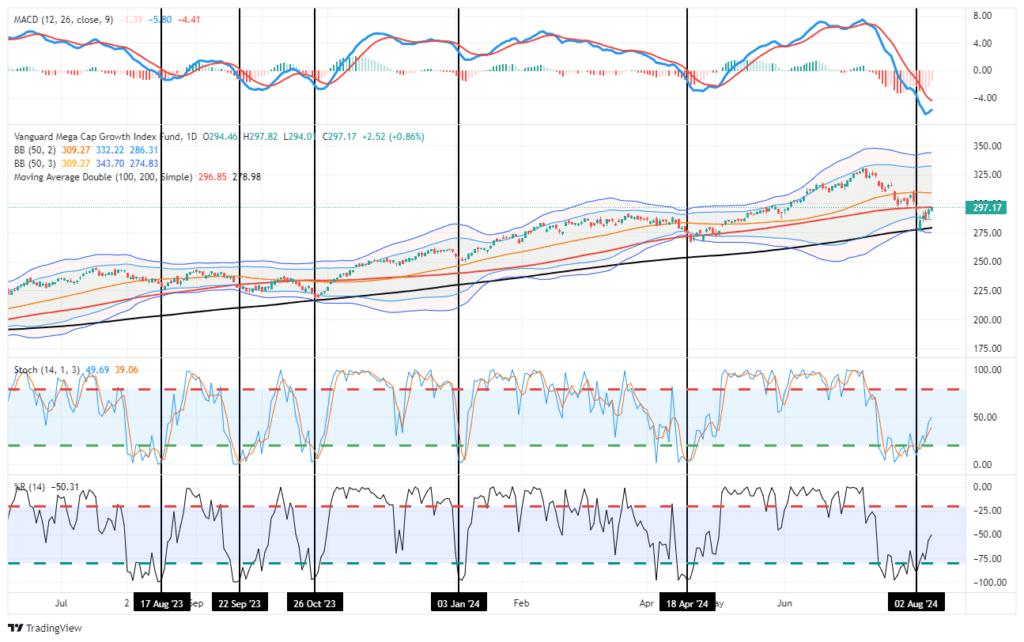
From a purely technical perspective, the “Mega-Cap” stocks have witnessed a sharp contraction over the last few weeks. Using the Vanguard Mega Cap Growth ETF (MGK) as a proxy for the largest companies, the recent correction has reversed most of the previous overbought and extended conditions.
MGK is oversold on multiple levels, and the MACD indicator is well below zero, which has previously coincided with short-term market bottoms. Furthermore, MGK tested and held the 200-DMA, which was also the lowest in October 2023. However, while technically oversold, many investors are “trapped” by the recent decline, so we will likely see some “selling pressure” as they look to exit, which would set up a retest of the 200-DMA before the correction is complete.
(Click on image to enlarge)
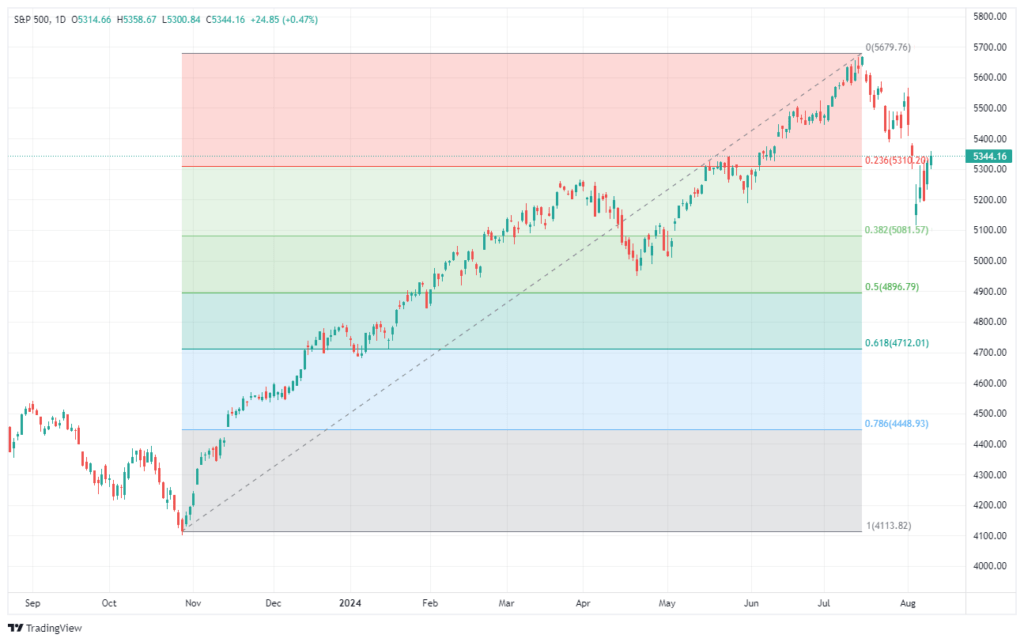
MGK already completed an initial 38.2% correction level using a Fibonacci retracement sequence from the recent high. While the 200-DMA is providing initial support to MGK, a failure of that support would bring a 50% retracement level into focus. Such would align with the lows of the April correction.
(Click on image to enlarge)
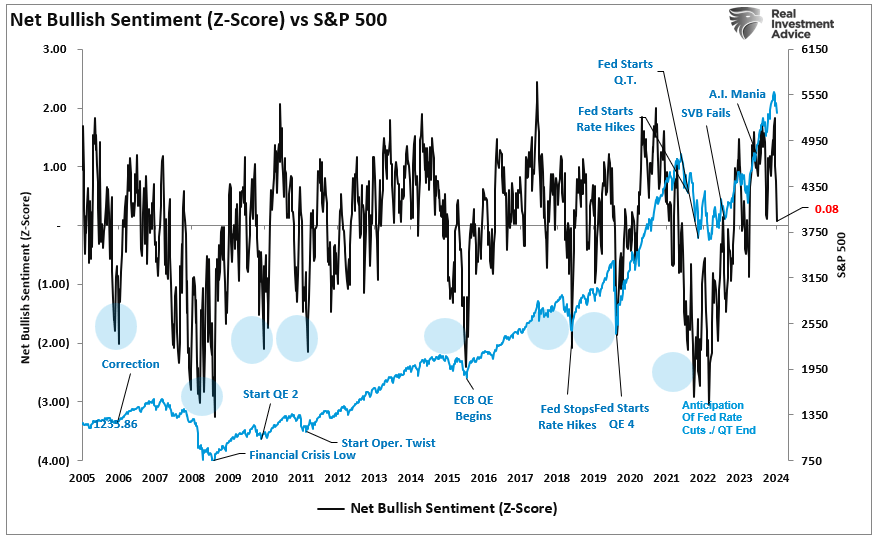
Given the short-term oversold conditions and the decline in sentiment, the reflexive bounce in the “Mega-Caps” we saw last week was unsurprising. However, as we suggested, given such a sharp rotation from recent highs, it may only be a “tactical trading opportunity” before the completion of the correction process. This is because “bullish sentiment” remains elevated, historically not what is seen at corrective lows.
(Click on image to enlarge)
We suspect that while we could see an oversold bounce following the recent sell-off, “trapped longs” will likely use any such opportunity to exit positions. Therefore, we suggest the following rules for whatever comes next.
More By This Author:
Patience Pays In Volatile Markets
The Market Crash Heard Around The World
Labor Hoarding: The Labor Market Lynchpin


Comments
Log in or sign up to join the conversation.