
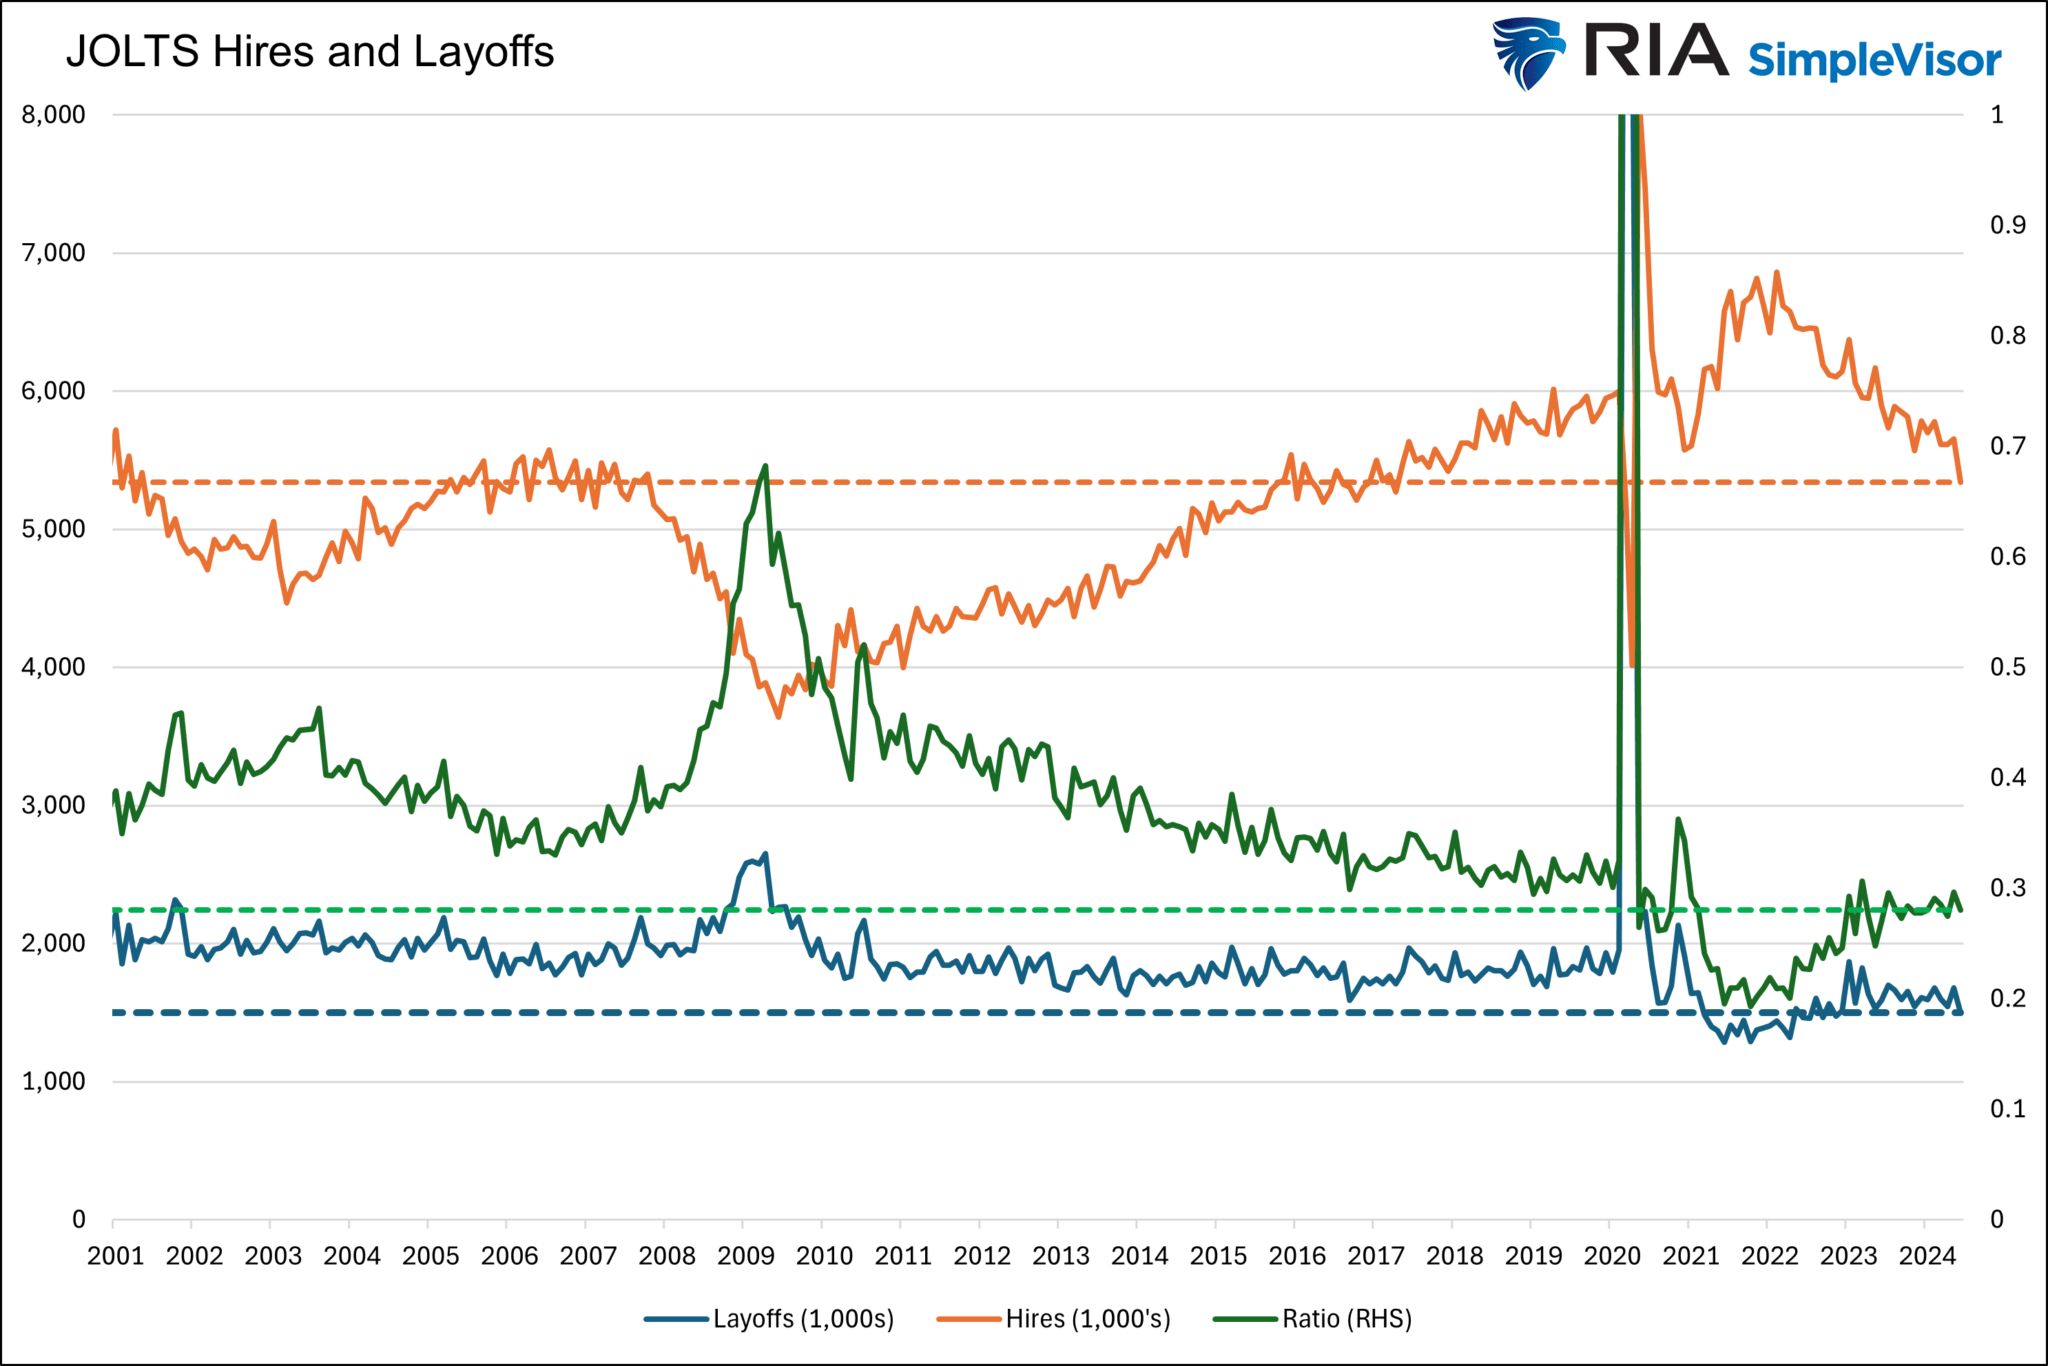
According to the latest JOLTs report from the BLS, the number of job hires has fallen back to levels from 2017. Despite the rate of hires falling below the pre-pandemic trend, the labor market remains relatively strong. Why is this occurring? According to a Bloomberg article entitled The Labor Market Confronts the End of Pandemic-Era Job Hoarding, employers are still “scarred by the enormous difficulty they encountered trying to hire staff during the pandemic.”
The graph below shows how labor hoarding buoys the current job markets. It compares the JOLTs hires we mentioned above to JOLTs layoffs. Moreover, we added a ratio of the two to assess their relationship better. As shown, businesses are hiring at a lower-than-normal clip but holding on to workers. The layoffs line is still decently below the pre-pandemic trend and not really showing signs of turning up. The ratio has turned higher but is also below the pre-pandemic trend. Labor hoarding should offset the lack of new hiring and support a good labor market. However, there are risks if employers no longer feel the need for labor hoarding. Per Bloomberg:
There’s a risk the dynamic feeds on itself. As unemployment increases — and it hit 4.3% in July, up almost a full percentage point compared with the start of last year — firms may realize that labor is becoming more available “and stop hoarding workers,” Oliver Allen, senior US economist at Pantheon Macroeconomics, wrote in a note last week.
(Click on image to enlarge)
What To Watch Today
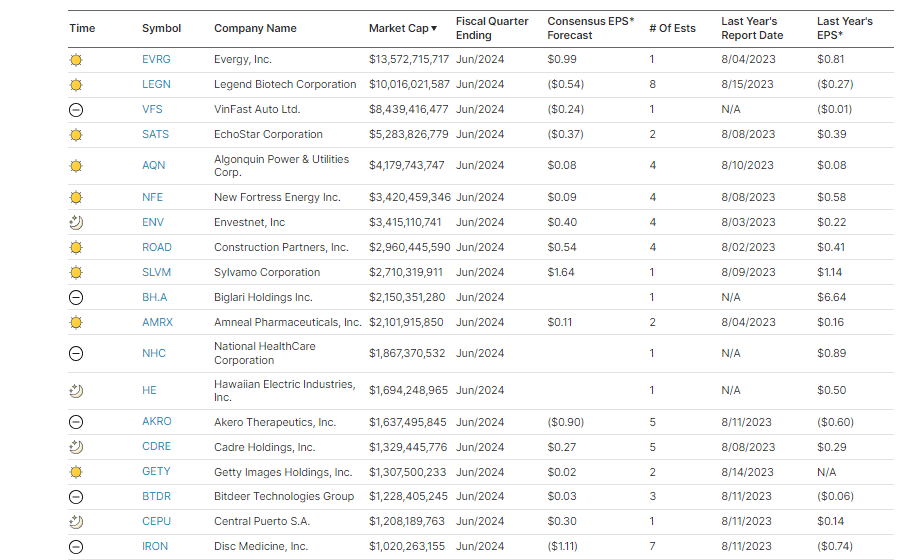
Earnings
(Click on image to enlarge)
Economy
- No notable economic reports
Market Trading Update
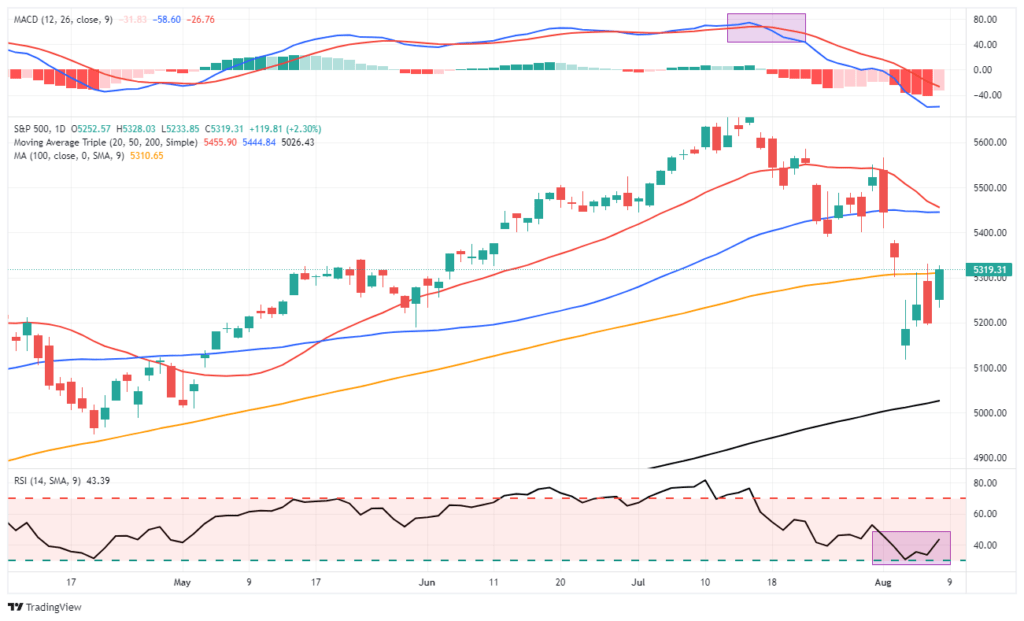
Since the crash on Monday, the market has staged three rally attempts to breach resistance at the 100-DMA. The first two attempts were rebuffed on Tuesday and Wednesday, but a broad rally on Thursday claimed the prize. However, as is always the case, the break above resistance must be held for a few days to confirm its validity. We have seen the previous breaks of resistance often fail in the next couple of days.
Notably, with the recent correction, the exhaustion of sellers certainly gives the market fuel to rally a bit more. If the break above the 100-DMA holds, a further rally towards the 50-DMA becomes viable. However, with the 20-DMA set to cross below the 50-DMA next week, that resistance level will become more challenging to break. As such, use the current rally to rebalance risk and reduce exposure as needed in portfolios. This initial rally from Monday’s low will likely fail, and the market will retest the recent low at least once before this correction process is complete.
(Click on image to enlarge)
Truflation Inflation Update
In January, we introduced Truflation to our readers. As we wrote:
Trueflation was created to be a better CPI. Accordingly, Trueflation removes hedonics, imputed costs, and smoothing methods. It also uses real-time market prices from multiple sources. Perhaps most importantly, it regroups categories and reassigns weights to make its index more representative of actual consumption and price trends. Click HERE for more on their methodology.
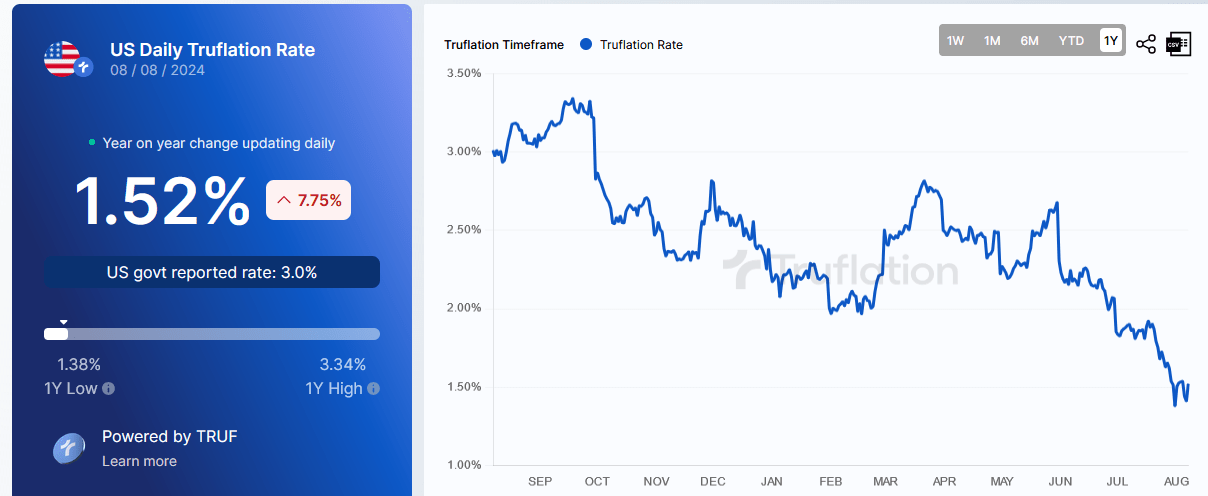
Per Danielle DiMartino Booth, the correlation between CPI and Truflation is 99%. While Truflation tends to be more volatile than CPI as it uses real-time data and eliminates smoothing, hedonics, and surveys, its trend is well aligned with CPI. As shown below, the Truflation inflation gauge stalled and uptick from February to June. Since then, it has resumed its trend lower. The Truflation rate is 1.52%, well below the 3% CPI rate.
(Click on image to enlarge)
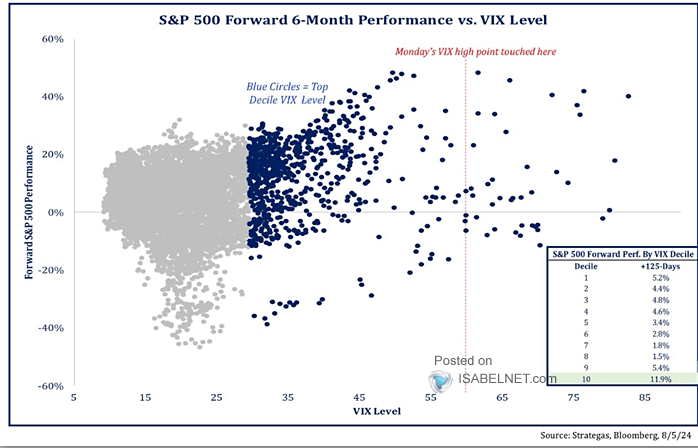
Stock Returns After Heightened Volatility
The scatter plot below, courtesy of Strategas and Isabella.net, shows how the S&P 500 reacts to the VIX. Specifically, it looks at 6-month forward S&P returns versus the level of VIX. While not definitive, forward returns generally increase in the six months after the VIX eclipses 35. Furthermore, the worst return experiences also increase.
While the graph may appear to present the recent spike as bullish, it’s important to remember the returns below are for the full six-month period. It is highly likely that in most cases, when the VIX was at levels we saw on Monday, there were further drawdowns before the market headed higher. Monday may have been a capitulation, but given there is a lot of macro noise between the yen carry trade, the presidential election, Israel/Iran, and the Fed embarking on an easing campaign, caution is warranted.
(Click on image to enlarge)
Tweet of the Day
“Want to achieve better long-term success in managing your portfolio? Here are our 15-trading rules for managing market risks.”
More By This Author:
The Bank Of Japan Calms Markets
Hedging Extremes Highlight Fear
The Yen Carry Dump


Comments
Log in or sign up to join the conversation.