A “Three Gap Play”

Image Source: Pexels
SPX Monitoring purposes; Long SPX 4/8/25 at 4982.77.
Our gain 1/1/24 to 12/31/24 = 29.28%; SPX gain 23.67%
Our Gain 1/1/23 to 12/31/23 SPX= 28.12%; SPX gain 23.38%
Monitoring purposes GOLD:Long GDX on 10/9/20 at 40.78.

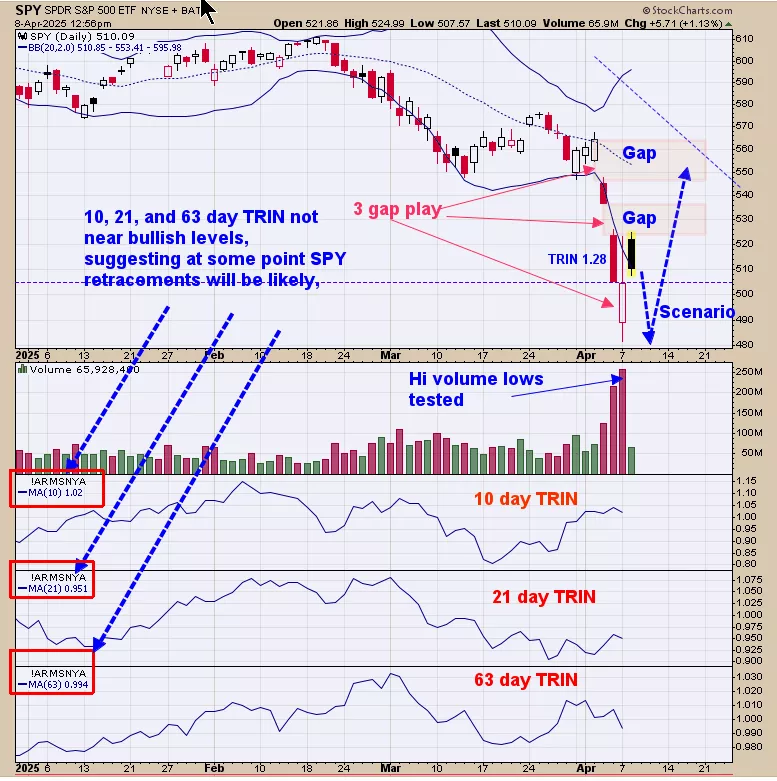
We ended up 29.28% for 2024; SPX up 23.67% for the year. Yesterday’s volume was higher today than Friday’s suggesting at some point yesterday’s low will be tested; if the test comes on lighter volume a bullish sign will be triggered. The pattern forming appears to be a “Three Gap Play”. A “Three Gap Play” is a pattern where market gaps three times in a row and the third gap ends the decline. Some times the low of the third gap is tested (may happen here) before market rallies back to test the first gap. The TRIN and tick reading intraday are showing panic which is a bullish sign. The 63, 21 and 10 day trin are not near bullish levels suggesting there may be back and filling in the market until those moving averages reach bullish levels. The TRIN closed at 2.42 and tick at -607 which is a bullish combination and buy signal; long SPX on 4/8/25 at 4982.77.

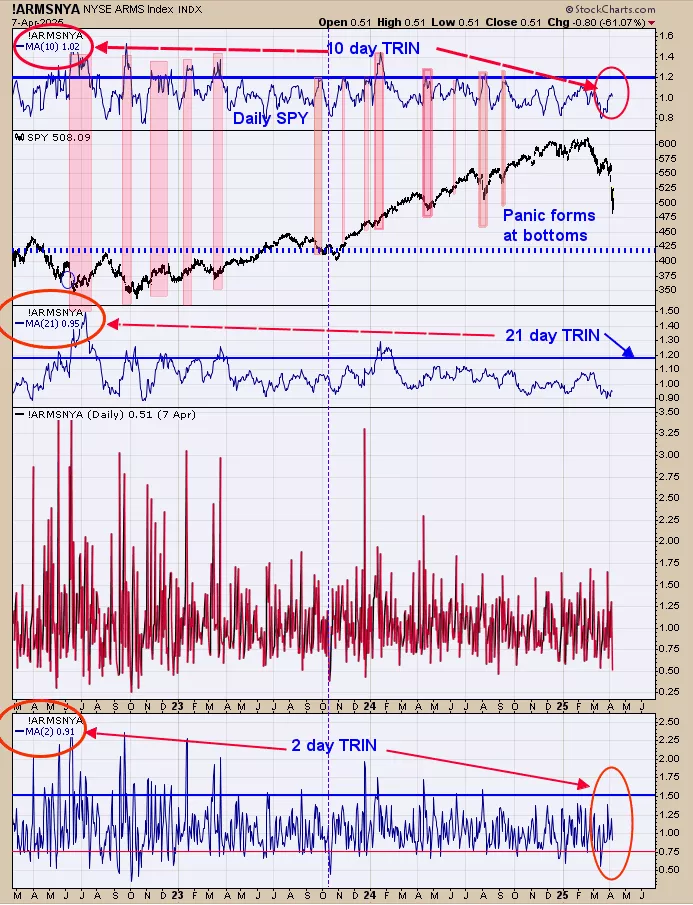
Updated chart from yesterday and yesterday’s commentary still stands, “The top window is the 10 day TRIN which stands at 1.05.The TRIN told the true condition of the market. At the time I was concluding it was not working; but it was; lesson learned. We noted with shaded pink areas when the 10 day TRIN reached 1.20 and higher. The 10 day TRIN of 1.20 show panic and panic forms near lows. The 10 day TRIN hasn’t reached near 1.20 range since last September. Market could be near a bounce but market is not setup for a longer term bottom until the 10 day TRIN reaches 1.20 or higher. For the very short term, the TRIN closed Friday at 1.28 (bullish but not real bullish) and the tick closed at -99; leans bullish. The combination of the TRIN and Tick today did learn bullish but not a strong signal. Today’s SPY volume has higher than Friday’s volume suggesting at some point today’s low will be tested again; and where a strong signal may develop.”

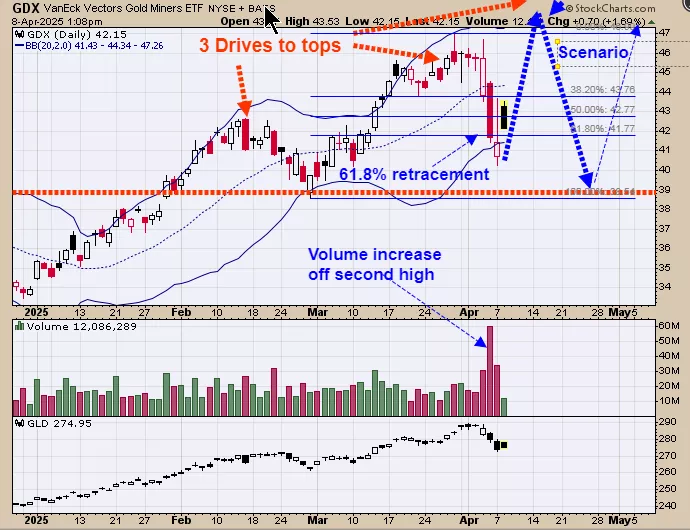
Friday’s volume appears to be “Selling climax” and ends the decline. Yesterday’s trading tested Friday’s low on lighter volume and a bullish sign. The pattern that appears to be forming is a “Three Drives to Top” pattern. This pattern has a high volume pull back off of the second top that retraces at least 61.8% of the previous rally (both condition where bet on current setup). What happens next is a rally to new highs creating a “third top”.The third top is usually a high (sometimes the third top is tested) and then the market pulls back to where the pattern began; in this case it would be near the 39.00 level. “Three drives to top” is not a long term topping pattern but rather a “Time out in an uptrend”;suggesting the 39.00 GDX could be the next good buy area.
More By This Author:
Gold May Get Stronger In The Coming Weeks
A Multi Week Rally Is Starting
A Low In The Market Is Near
Signals are provided as general information only and are not investment recommendations. You are responsible for your own investment decisions. Past performance does not guarantee future performance. ...
more


