
The latest retail sales report seems to have given Wall Street something to cheer about. Headlines touting resilience in consumer spending increased hopes of a “soft landing” boosting the stock market. However, as is often the case, the devil is in the details. We uncover a more troubling picture when we peel back the layers of this seemingly positive data. Seasonal adjustments, downward revisions, and rising delinquency rates on credit cards and auto loans suggest a more cautious view. The consumer—the backbone of the U.S. economy—may be in more trouble than the headline numbers indicate.
The Mirage of Seasonal Adjustments
The July retail sales report showed a sharp increase of 1.0% month-over-month, surpassing expectations. However, while that number supports the idea of a resilient consumer, these spikes have been more anomalous than not. Since 2021, real retail sales have virtually flatlined. Such is unsurprising as consumers run out of savings to sustain their standard of living.
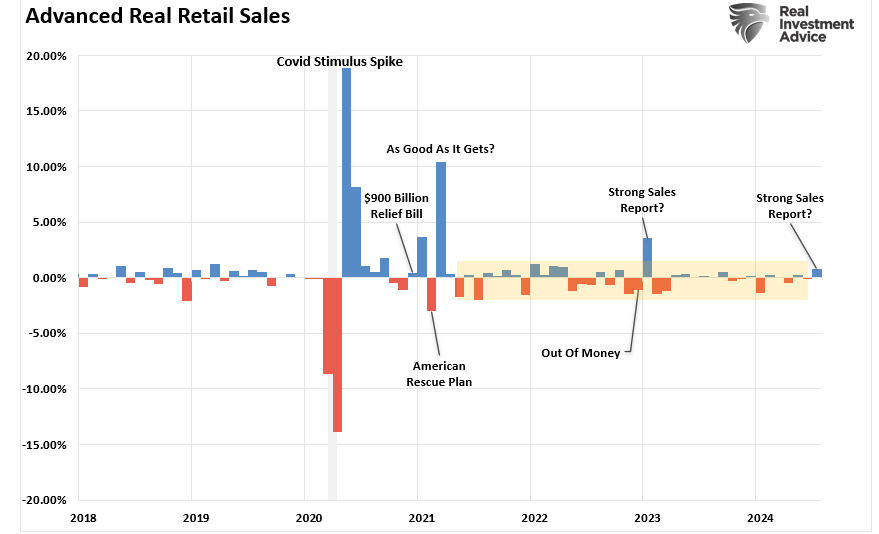
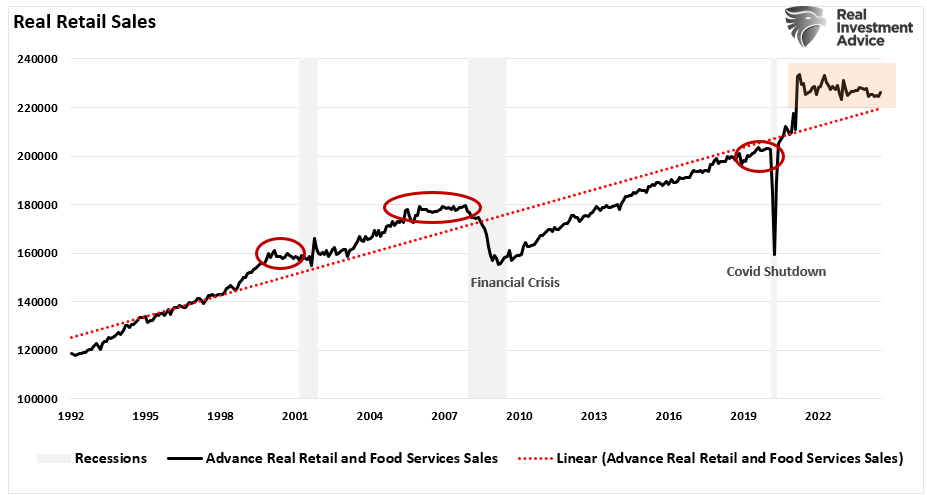
The following chart of real retail sales clearly shows the consumer dilemma. Over the past two years, retail sales have not grown to support more robust economic growth rates. Notably, flat real retail sales growth was pre-recessionary and a “red flag” of weakening economic growth. However, given the massive surge in spending driven by repeated rounds of Government stimulus, the reversion of retail sales to the long-term trend has taken longer than previous periods, leading economists to believe “this time is different.”
But before we break out the champagne, let’s examine how these numbers are calculated. Retail sales data is notoriously volatile. Factors like weather, holidays, and even the day of the week play a significant role. To smooth out these fluctuations, the data is seasonally adjusted. The chart shows the magnitude of these seasonal adjustments since 1992. Interestingly, the magnitude of these adjustments is increasing over time.
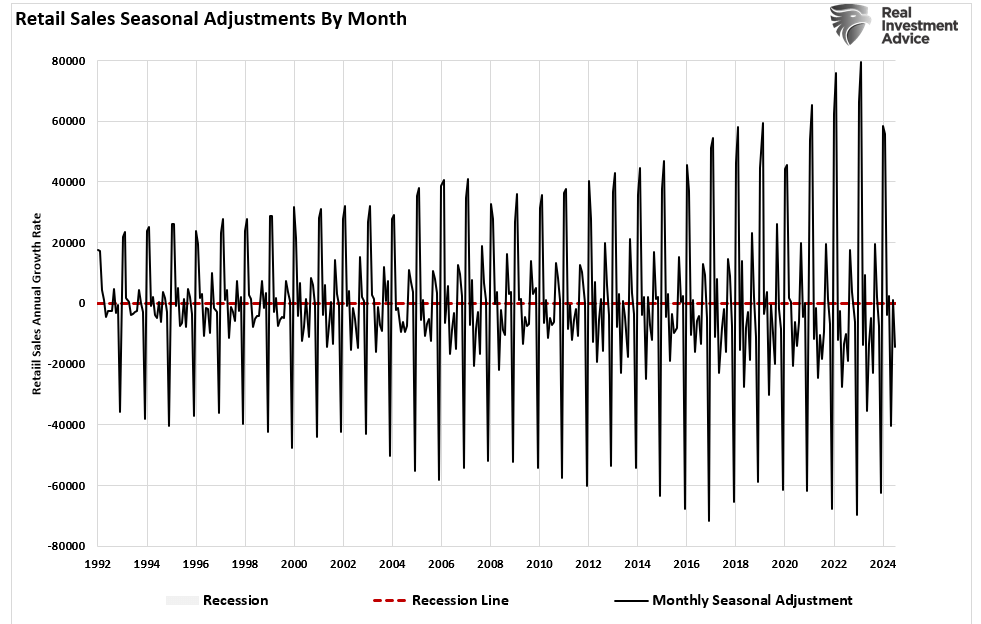
But what happens when those adjustments paint an overly rosy picture?
Downward Revisions: A Growing Trend
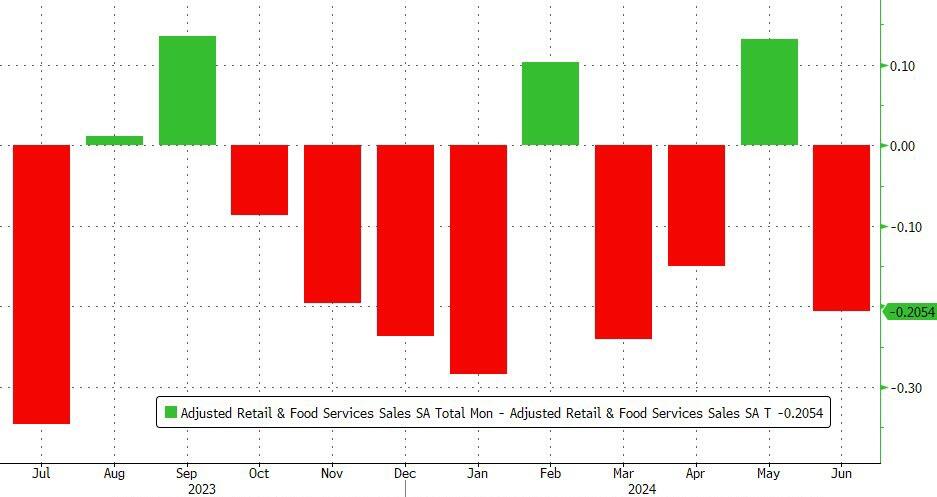
Seasonal adjustments are a double-edged sword. While they aim to provide a clearer view of underlying trends, they can also distort reality, especially in an economy as dynamic and unpredictable as ours. Unfortunately, these adjustments are often revised in hindsight as more data becomes available. For example, a “red flag” is that eight of the past twelve-monthly retail sales reports were revised significantly lower, making the recent monthly “beat” much less impressive.
Why are retail sales being revised downward so frequently? One possible explanation is that initial estimates are overly optimistic, perhaps due to seasonal adjustments. As more accurate data becomes available, the true picture emerges, and it’s not as pretty as many believe. So, is there potentially a better method?
As noted, monthly retail sales are volatile due to various events. Christmas, Thanksgiving, Easter, summer travel, back-to-school, and weather all impact consumer spending. Therefore, “seasonally adjusting” the raw data may seem necessary to smooth out these periods of higher volatility. However, such a process introduces substantial human error. Using a simplistic 12-month average of the non-seasonally adjusted data (raw data) provides a smoother and more reliable analysis of consumer strength. Historically, when the 12-month average of the raw data approaches or declines below 2% annualized, it is a “red flag” for the economy. Again, the massive spike in COVID-related stimulus is reversing towards levels that should concern investors.
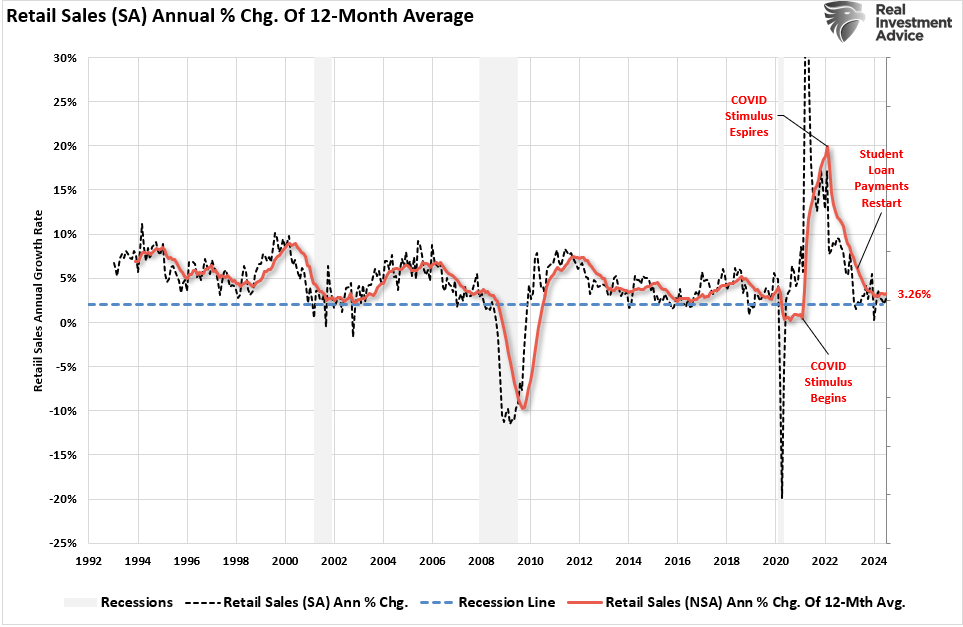
In other words, if we strip out the seasonal adjustments and apply a smoothing process to volatile data, the issue of consumer strength becomes more questionable.
Another “red flag” is realizing that retail sales should grow as the population grows. If we look at retail sales per capita, we see that before 2010, retail sales grew at a 5% annualized trend. However, that changed after the “financial crisis,” retail sales fell well below the previous trend despite an increasing population. While that gap improved following the Covid-stimulus supports, the gap is once again widening.
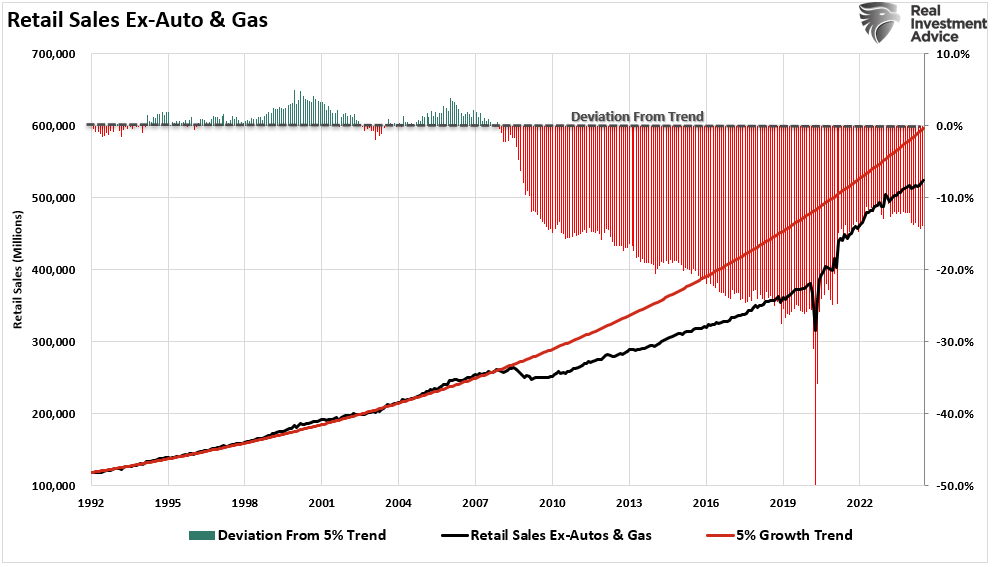
As you can see, the data shows a much more subdued picture of consumer spending, which raises a critical question: Are we being lulled into a false sense of security by the headline numbers? The reality is likely far more sobering.
The Debt Bomb: Rising Delinquency Rates
Perhaps the most alarming signal comes from the rising credit card and auto loan delinquency rates. Consumers have been relying heavily on credit to maintain their spending habits in the face of high inflation and stagnant wage growth. The spread between retail sales and consumer credit to disposable personal income rises as COVID-related stimulus runs dry and inflation is outstripping wages, forcing consumers to turn to credit.
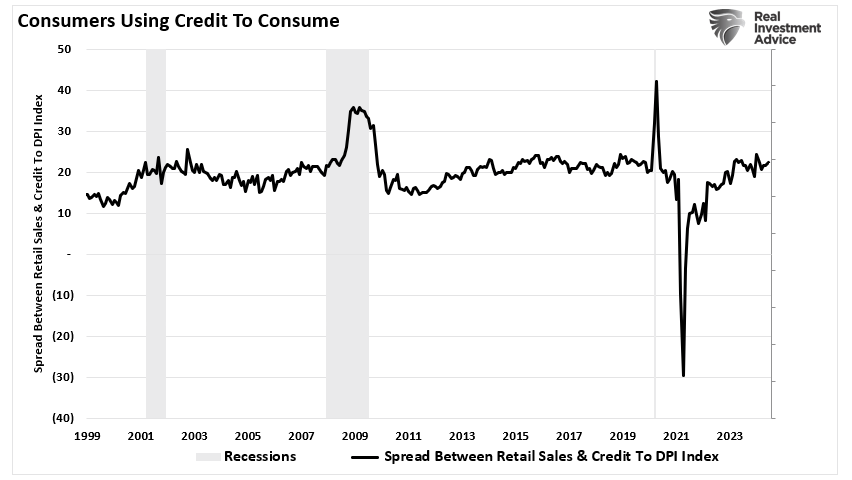
But there’s a limit to how much debt consumers can take on before the house of cards tumbles.
According to the latest data, delinquency rates (more than 90 days) on both auto loans and credit cards have reached their highest level since 2012. Notably, delinquency rates are rising the fastest for younger generations that tend to have lower incomes and less savings. (Charts courtesy of Mish Shedlock)


These rising delinquency rates are a warning sign that consumers struggle to keep up with their debt obligations. As more consumers fall behind on their payments, the risk of a broader economic slowdown increases. After all, consumer spending accounts for nearly 70% of U.S. GDP. If the consumer falters, the entire economy is at risk.
The Implications for Future Consumption
Given these “red flags,” it is difficult to see how the current level of consumer spending can be sustained. Rising delinquency rates, downward revisions to retail sales, and questionable seasonal adjustments all suggest the consumer is running out of spending power.
In the near term, we may continue to see headline retail sales numbers that appear healthy, especially if seasonal adjustments continue to provide a tailwind. However, the underlying data tells a different story. As more consumers reach their debt limits and delinquency rates continue to rise, we could see a significant spending slowdown later this year.
That slowdown would have far-reaching implications for the broader economy. Retailers could see further revenue declines, leading to potential layoffs and further weakening of consumer spending. Banks and financial institutions could also face higher loan losses, particularly in the credit card and auto loan sectors.
In summary, while the latest retail sales report may have given the market a short-term boost, suggesting a “soft landing” economically, the underlying data suggests we should be cautious. Seasonal adjustments and downward revisions are masking the actual state of consumer spending, while rising delinquency rates are a clear sign of trouble ahead.
Investors and policymakers would do well to look beyond the headlines and focus on the economy’s real risks. The consumer may be hanging on for now, but the cracks are starting to show. Ignoring these red flags could lead to a rude awakening in the months ahead.
More By This Author:
Jackson Hole Takes Center StageExtreme Volatility Is A Distant Memory
Price Gouging For Food: Reality Or Campaign Rhetoric?


Comments
Log in or sign up to join the conversation.