
Recently, Kamala Harris proposed that if elected, she would implement a ban on price gouging for food and groceries. Her goal is to lower inflation, as food prices have risen by about 20% over the last four years. The Harris campaign says the price gouging measure sets “clear rules of the road to make clear that big corporations can’t unfairly exploit consumers to run up excessive corporate profits on food and groceries.”
Currently, many states have rules banning companies from unduly profiting when a sudden change in the supply or demand of goods occurs. For instance, during hurricane preparation, states try to prevent hardware stores from increasing the price of plywood. While such rules make perfect sense, Harris’ price gouging proposal is flawed.
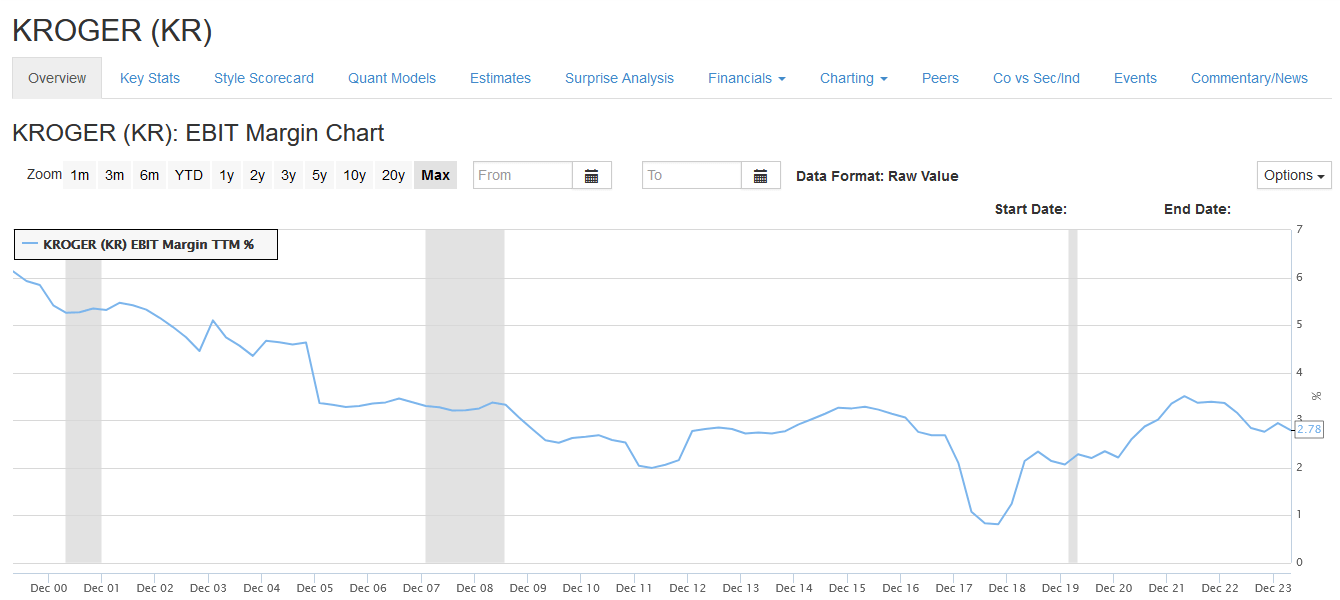
The graph below shows Krogers’s profit margin of 3.50%. Their grocery store competition has similar profit margins. Walmart and Costco, also competitors, although they sell non-food items, have profit margins of 4.00% and 3.50%, respectively. The point is that many grocery stores and other food sellers are not making excessive profits. For context, the S&P 500 has an aggregate profit margin of about 12%.
If grocers had to reduce their prices, their already slim margins would force them to reduce their expenses. Such would result in layoffs and store closures, both of which would harm the economy. The food inflation problem is not due to price gouging but excessive fiscal and monetary stimulus during the pandemic.
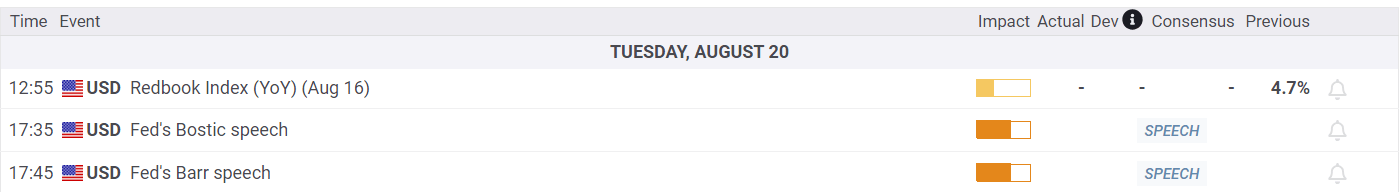
What To Watch Today
Earnings

Economy
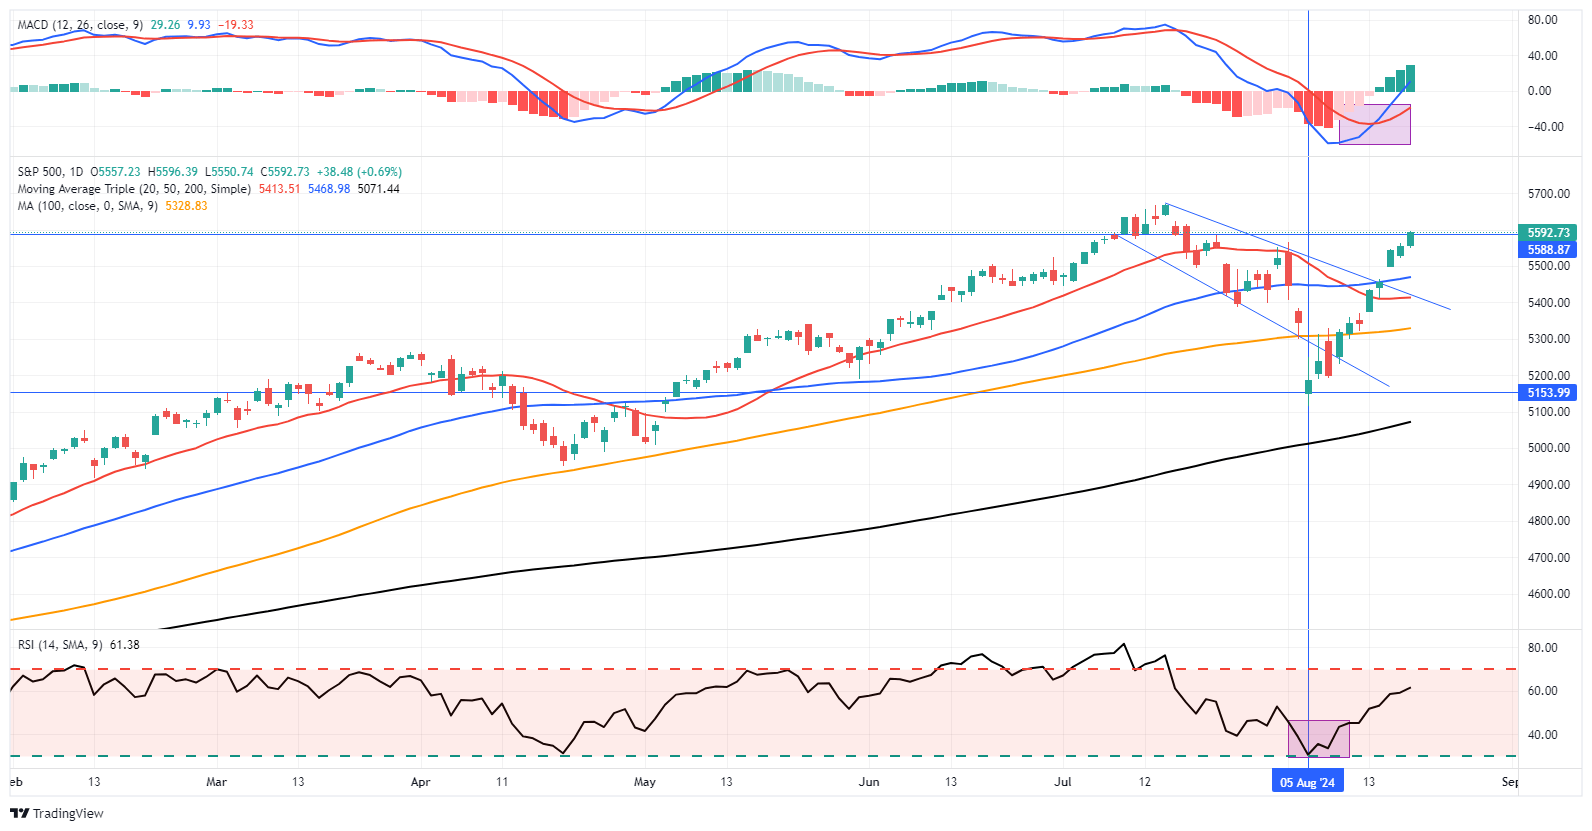
Market Trading Update
As noted yesterday, the recovery from the recent lows has been rapid, and the momentum continued again yesterday as the markets are now focused on all-time highs as the next resistance level. Currently, there is little to stop the rally as corporate share buybacks continue, and trading programs must accumulate roughly $10 billion daily through the end of the month.
However, once we get into September, things should cool down following the Jackson Hole Summit (Powell speaks on Friday), and the election will begin to take center stage. While we didn’t get an opportunity to add to exposures, small dips can be used to rebalance portfolios. It is worth noting that the oversold condition has been primarily reversed in the short term, so the upside will likely become more challenging. Trade accordingly.
(Click on image to enlarge)
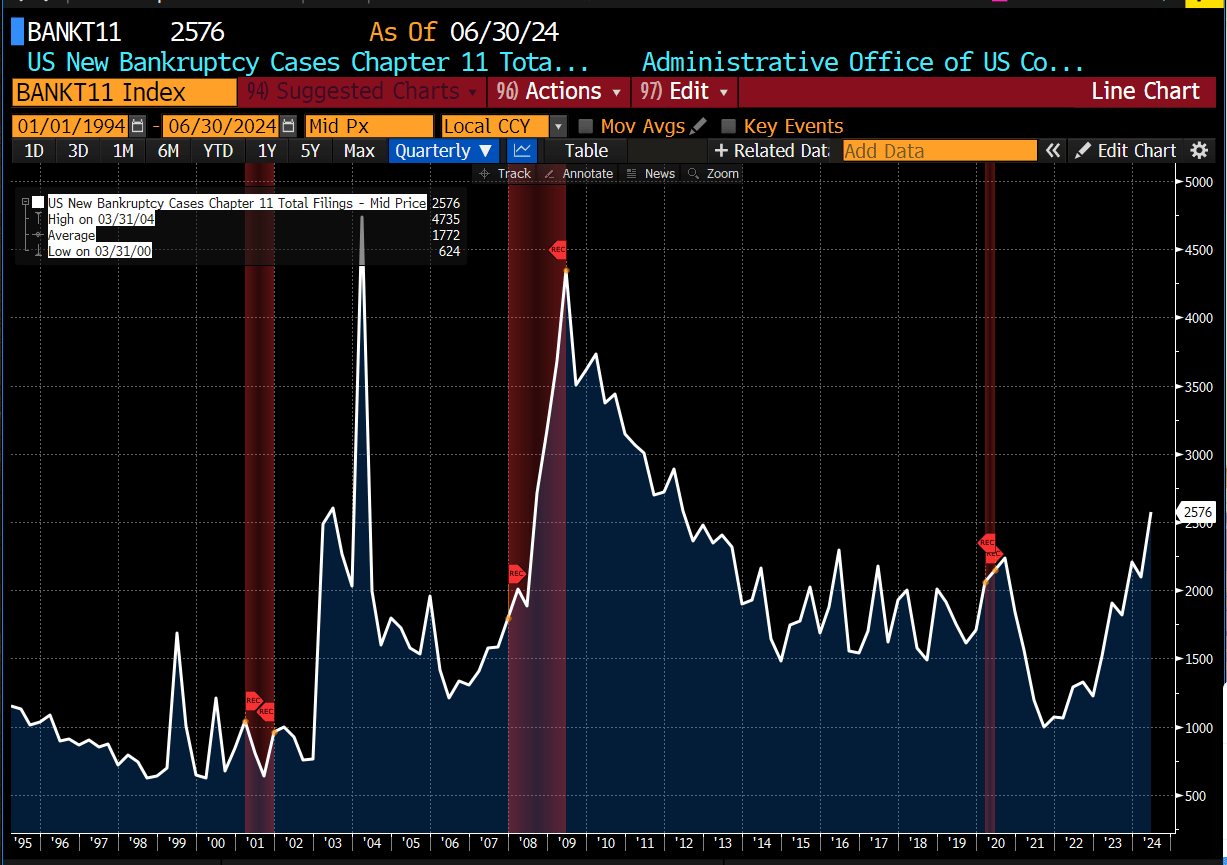
Bankruptcies On The Rise
The Bloomberg graph below shows that new Chapter 11 bankruptcy cases are rising. Bankruptcies tend to fall during economic expansion. Conversely, they increase sharply during or after the recession. The recent increase puts the number of bankruptcies above the rate in the pre-pandemic era.
Let’s hope this time is different!
SimpleVisor Shows Market Breadth Has Improved
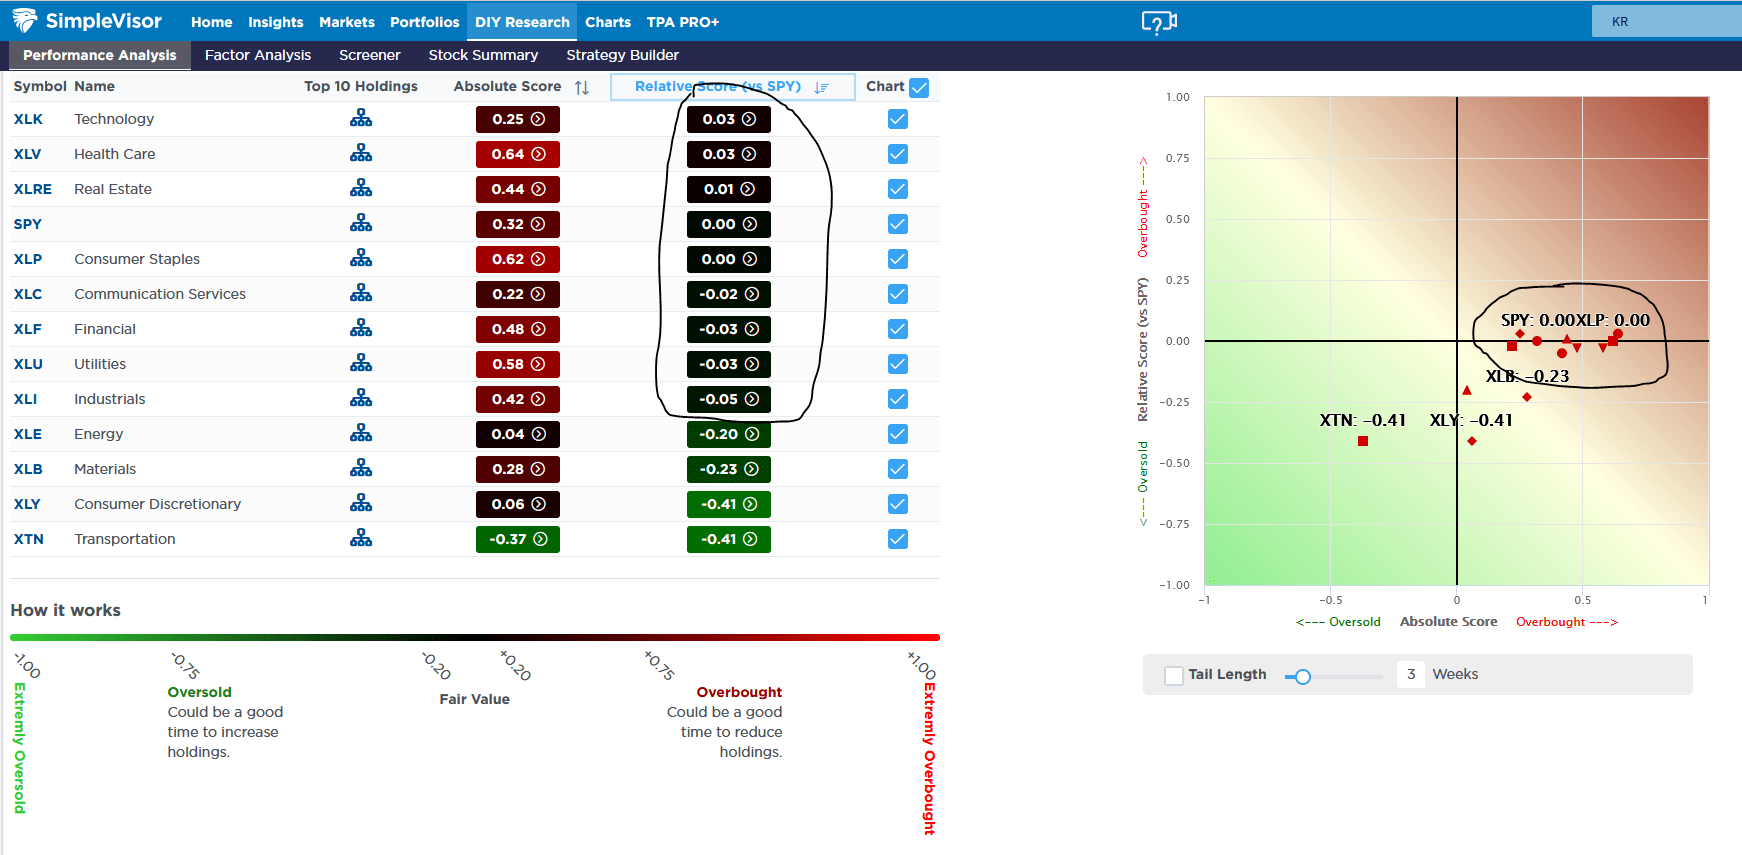
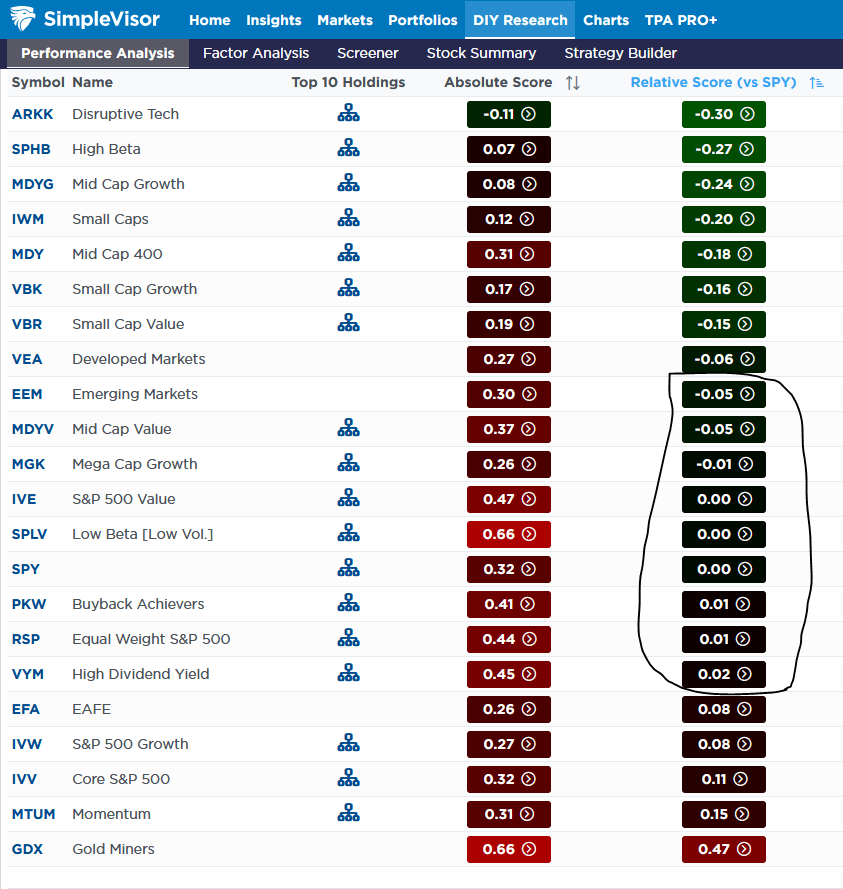
The first graphic from SimpleVisor’s proprietary sector and factor relative and absolute analysis tool shows that eight of the twelve sectors have relative scores near zero. The second graphic highlights that many factors have similar relative scores. Both graphics tell us that much of the market has been trading in line with the S&P 500. Therefore, market breadth is back to a more normal state. Over the last five years or so, in which we have run this analysis, we have never seen such even breadth. So, what comes next?
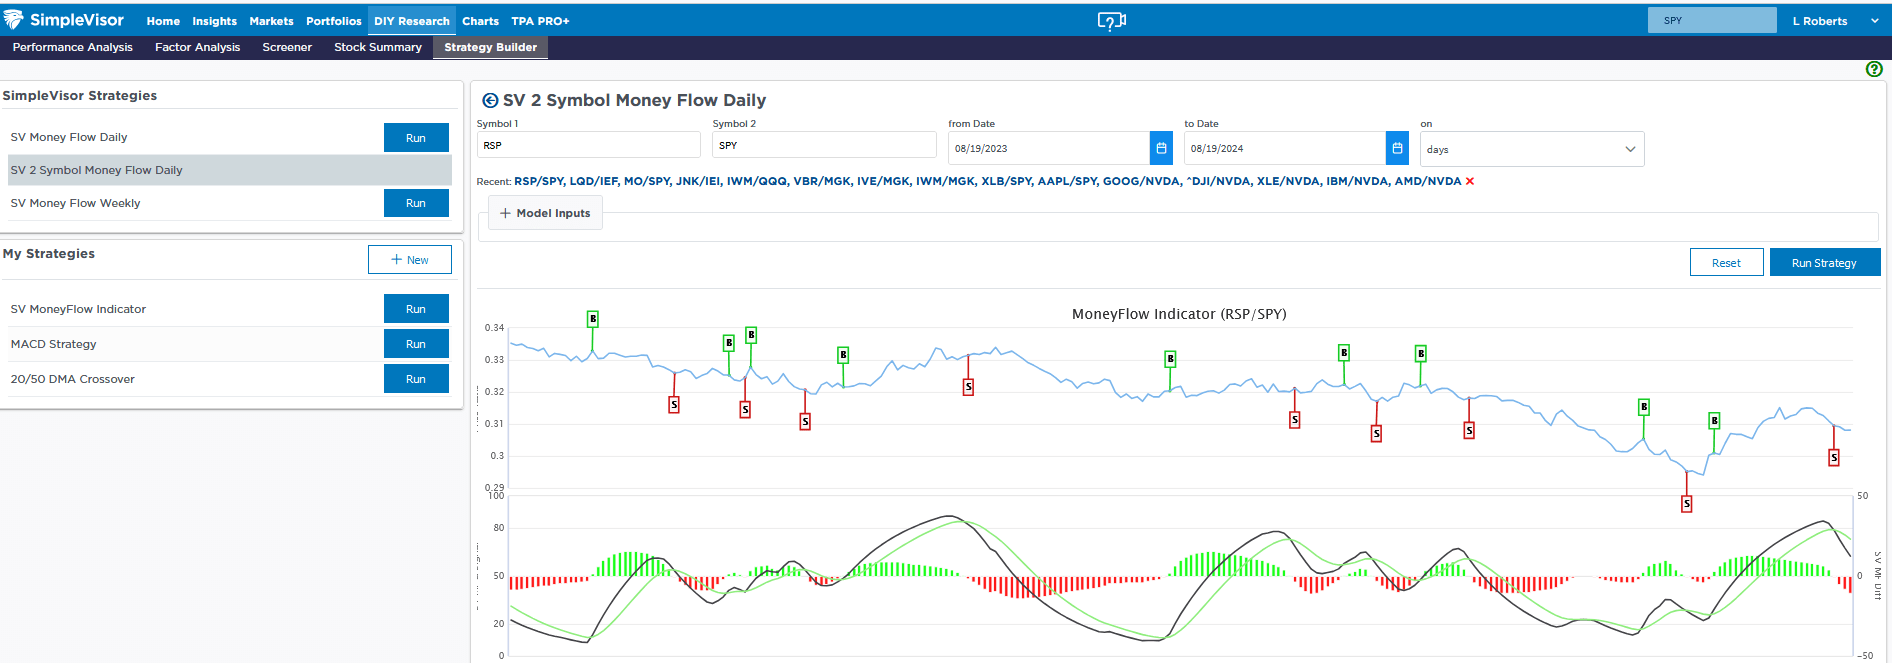
The third graphic can provide some hints. The SimpleVisor 2 Symbol Money Flow Daily graphs the price ratio of securities. Furthermore, the SimpleVisor propriety momentum model is shown beneath the price ratio graph. We ran the equal-weighted S&P 500 (RSP) to the S&P 500 (SPY). This pair is a good indication of market breadth. The graph shows the recent outperformance of RSP vs SPY. In addition, the SV momentum model is turning into a sell indicator. This indicates that SPY may likely outperform RSP in the coming days.
If the large-cap stocks again dominate performance, then SPY will beat out RSP, and the price ratio will decline further. However, this may be a rest before RSP gains further versus SPY. Lastly, the ratio may start to flatline, and the SV indicator may oscillate around zero. If that happens, breadth is likely to remain healthy.
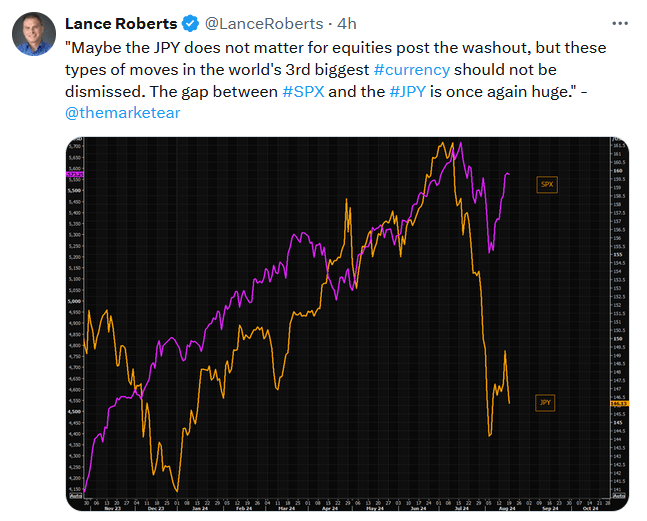
Tweet of the Day
More By This Author:
Market Decline Over As Investors Buy The DipOil And Bond Yields Are Tied At The Hip
Buybacks End The Market Correction

Comments
Log in or sign up to join the conversation.