

The national deficit debate usually focuses on entitlement and defense spending. While they have merit, they miss the single largest driver of America’s deteriorating fiscal picture. After the pandemic-related deficits, the cost of borrowing itself, not spending, has been the biggest deficit buster.
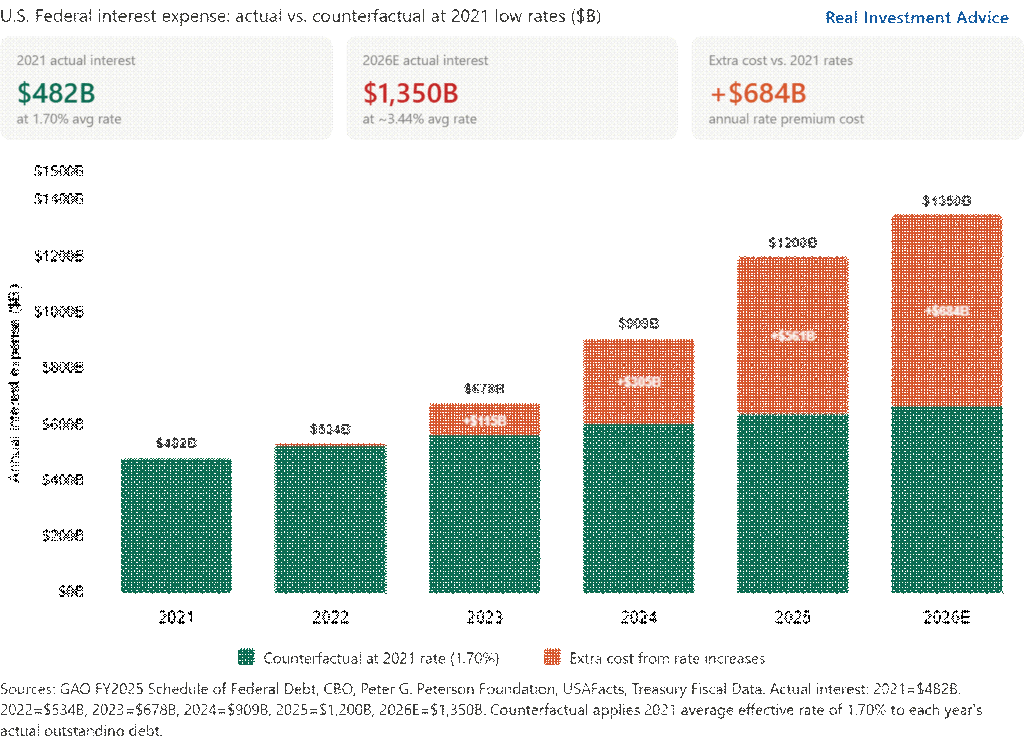
As shown in the first graph, in 2021, the government paid $482 billion in interest on $28.4 trillion of debt, at an average effective rate of 1.70%. Since then, interest rates have risen appreciably, with the interest on the federal debt for the current fiscal year expected to reach $1.35 trillion, at an average effective rate of approximately 3.44%. Today’s average interest rate is more than double the 2021 rate and, importantly, is applied to a rapidly growing stock of debt due to new issuance and the rolling of maturing debt.
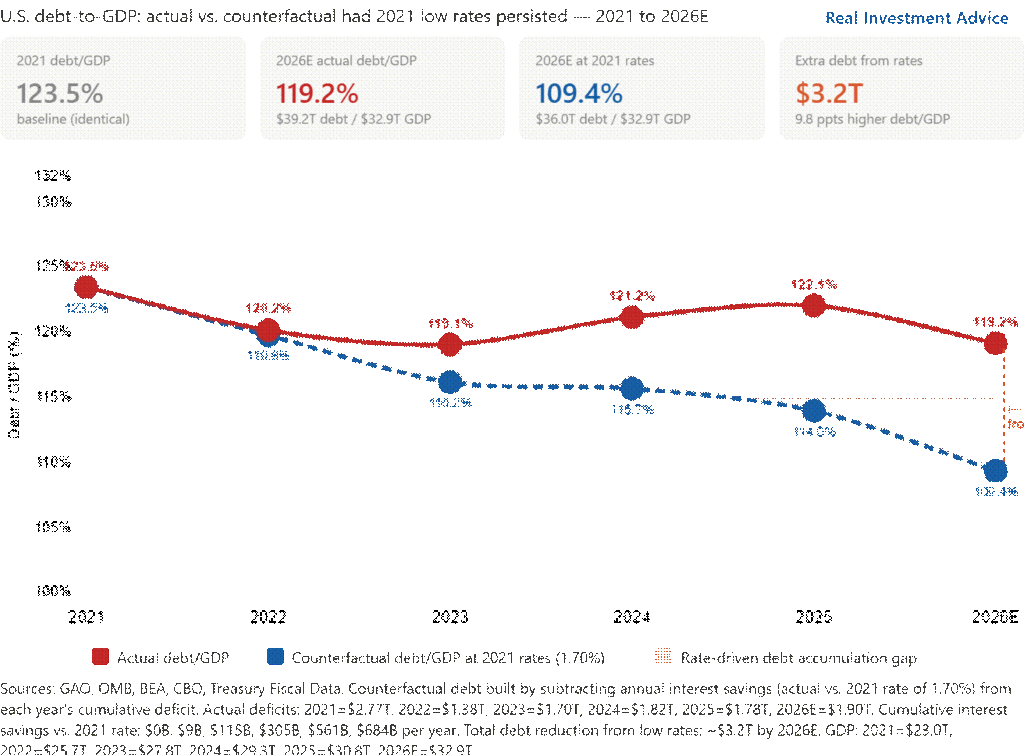
The second graph shows the deficit that would have resulted if interest rates hadn’t increased. In that hypothetical scenario, interest expense today would be around $650 billion, roughly half the current figure. The extra $684 billion in annual interest costs is not the result of deficit spending programs or legislative choices. It is purely due to higher interest rates. The compounding effect on total debt is also significant. Lower interest costs would have produced smaller annual deficits, which means less borrowing accumulating interest of its own. In our scenario, the total federal debt under the 2021 low-rate scenario would be approximately $36.0 trillion, rather than $39.2 trillion, and debt-to-GDP would be 109.4%, rather than 119.2%. For reference, the debt-to-GDP ratio was 107% before the pandemic-related deficit spending.
The fiscal situation is problematic, and we must urge our politicians to manage spending more effectively. But often forgotten in the debate, the rate environment has made it dramatically more urgent than it would otherwise be.
What To Watch Today
Earnings

Economy

Market Trading Update
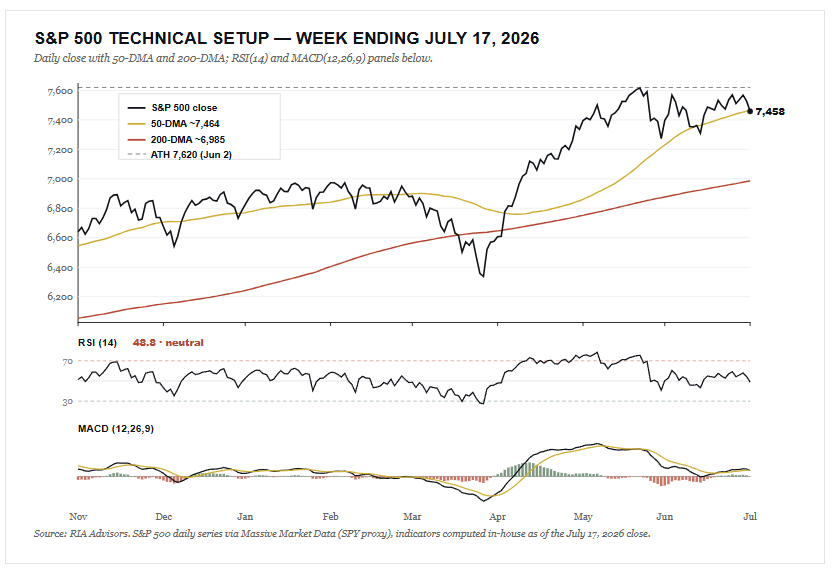
This is where the quiet-index story gets interesting for traders. The S&P 500 closed the week at 7,457.69, and that put it right on top of its 50-day moving average near 7,464. Call it dead flat against the line. The index still sits about 6.8% above its rising 200-day average near 6,985, so the primary uptrend remains fully intact, and it is roughly 2% below the June 2 record high of 7,620.
Momentum on the index itself is neutral, not broken. The 14-day RSI reads 48.8, smack in the middle of its range and nowhere near oversold. The MACD is the wrinkle. It just rolled below its signal line for the first time since the April low, and the histogram flipped negative. That is a fresh bearish crossover. One crossover is not a sell signal, but it is exactly the kind of longer-term warning we watch for as a correction builds.
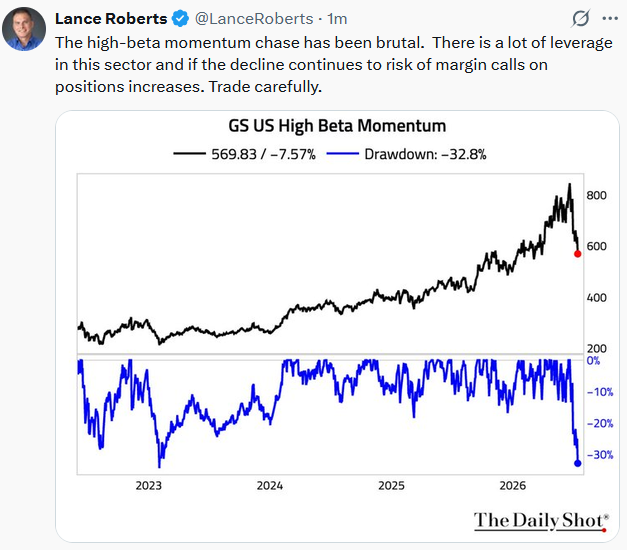
The contrast between the index and the factor is the whole point. The Momentum ETF, MTUM, fell about 6% on the week and printed a 14-day RSI of 41, far weaker than the broad market. The average stock barely flinched. The equal-weight S&P lost less than half a percent and actually tagged a fresh record high midweek, and the Russell 2000 held up better than the Nasdaq. When the cap-weighted index falls, but the median stock does not, the damage is narrow by definition.
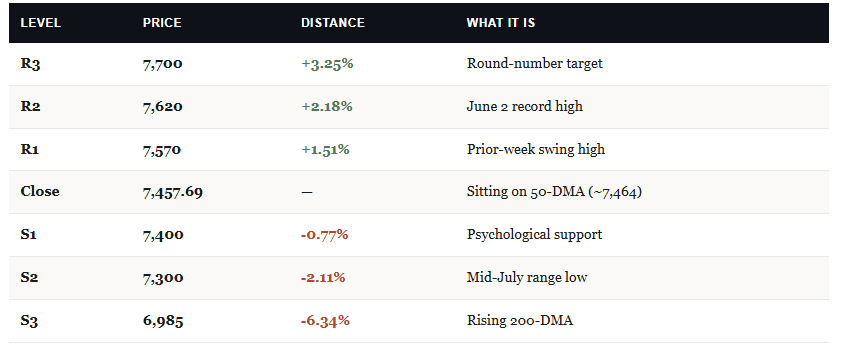
So how do you trade it? The 50-day is the line in the sand. Therefore, a decisive hold keeps the burden of proof on the bears, and the first real test on a break sits at the mid-July range low near 7,300. I would not chase the semiconductor and high-beta names lower into a knife that is still falling, and I would not short a market whose average stock is making new highs. This is a spot to rebalance risk, not to place a directional bet. Hold 7,464, and the rotation stays healthy. Lose it on volume, and the correction earns a wider berth.
The Week Ahead
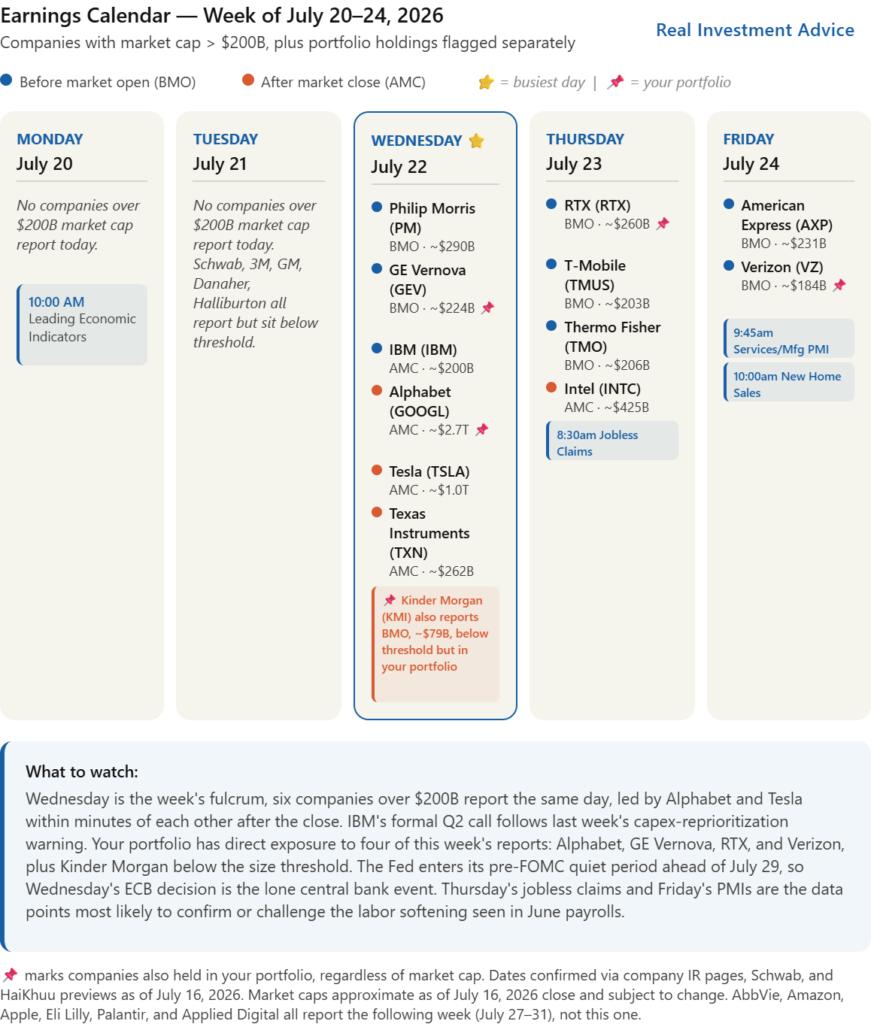
Earnings announcements kick into high gear this week with Alphabet and Tesla both reporting Wednesday evening alongside Philip Morris, Texas Instruments, and IBM’s formal Q2 call, a week after its preliminary capex-reprioritization warning rattled the stock. Thursday adds Intel and RTX, while American Express closes the week on Friday.
Economic data is comparatively light. Thursday’s initial jobless claims will be watched closely for any confirmation of the labor softening we saw in June payrolls. Friday brings new home sales, a read on how the recent spurt higher in mortgage rates is negatively impacting the housing market.
With the next FOMC decision landing on July 29, the Fed enters its traditional pre-meeting quiet period this week, meaning no speeches to move markets.
Home Affordability: Better Than The Headlines Suggest
Here are the “facts” that the media tells you about home affordability.
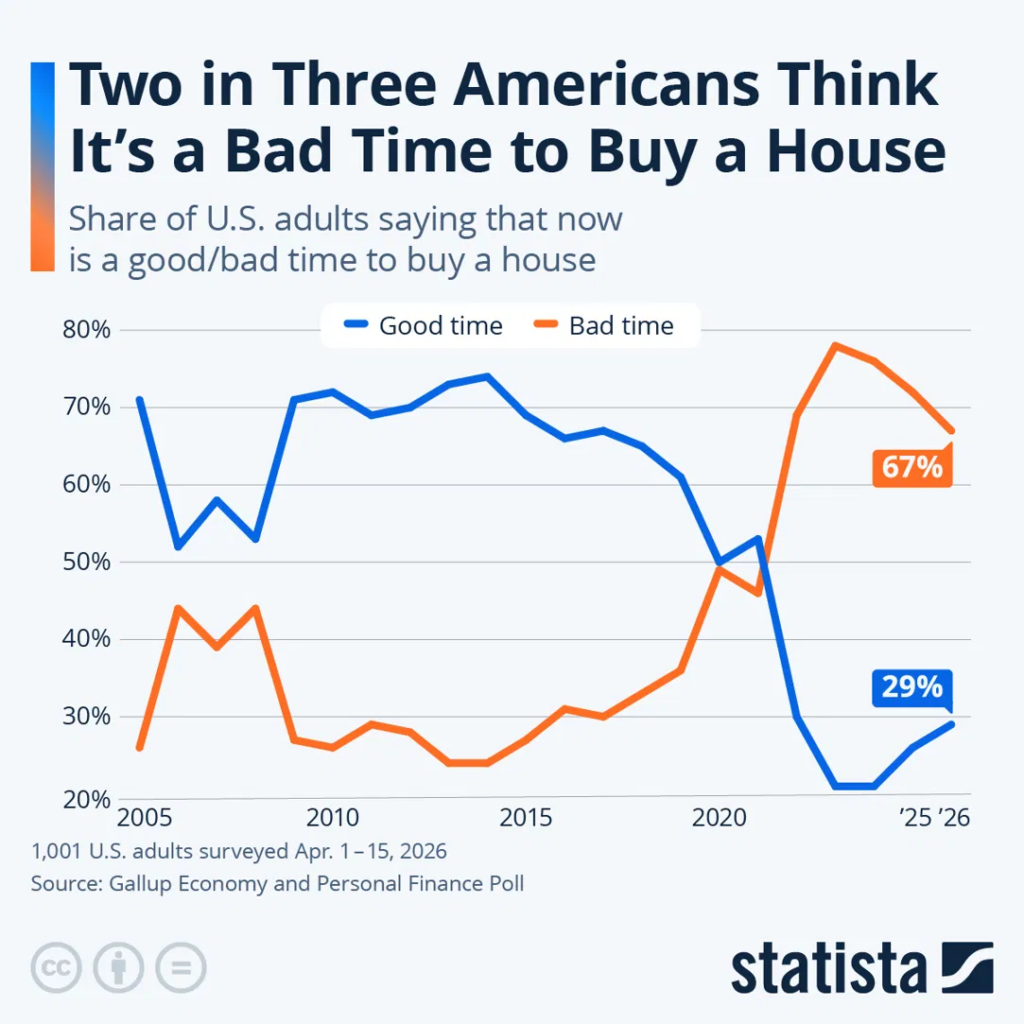
Let’s start with a recent survey. Two out of three Americans now say it’s a bad time to buy a house, the most negative reading Gallup has ever recorded.1 Another study showed that a record 25.2 million adults under 35 are living with their parents.2 Scroll any feed, and you’ll hear that home affordability has priced an entire generation out for good. Those are the “facts” according to the media.
However, here’s the problem with that story. When you measure home affordability today against the metric that actually governs the check you write each month, the picture flips. By that measure, buying a home may be easier now than it was for the Boomers and Gen Xers who get blamed for everything.
Let me be clear about what’s real, because I won’t build an argument on a false floor. Since 2019, the median listing price has jumped about 34% to roughly $430,000.3 The payment on a median home went from near $1,700 in early 2020 to about $3,100 by late 2025.4 Rates tripled off the 2021 lows. That shock was real, and it landed in five short years.
So the frustration makes sense. What doesn’t hold up is taking a recent, regional price spike and turning it into a permanent law of physics that applies to every zip code and every buyer. The honest version of home affordability today is narrower, more local, and far more fixable than the headline suggests.
But let’s start with the narrative that the Boomer generation had it easy. As one individual posted on X:
“You boomers had it easy, you could buy a home for the price of bread and a gallon of milk.”
Tweet of the Day


Comments
Log in or sign up to join the conversation.