


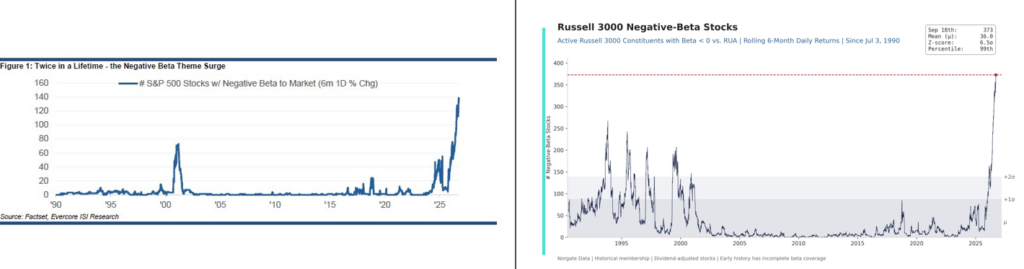
According to the graph on the left, Evercore counts 140 S&P 500 members with a negative beta, the highest on record. On the right side, that measure for the Russell 3000 stands at 373 stocks, more than 10x its long-term average of 36. That is 6.5 standard deviations from the mean and, statistically speaking, an event that should happen once every 99 million years!
Negative beta means a stock has moved opposite to the index over a defined trailing period. With the S&P 500 and Nasdaq trending upward and at or near record highs, the beta statistics imply many companies have been trending lower. This reflects the high concentration within the indexes. To wit, the Magnificent Seven stocks in the S&P 500 comprise about 35% of the index. Therefore, about 493 companies account for 65% of the index, or roughtly .13% each.
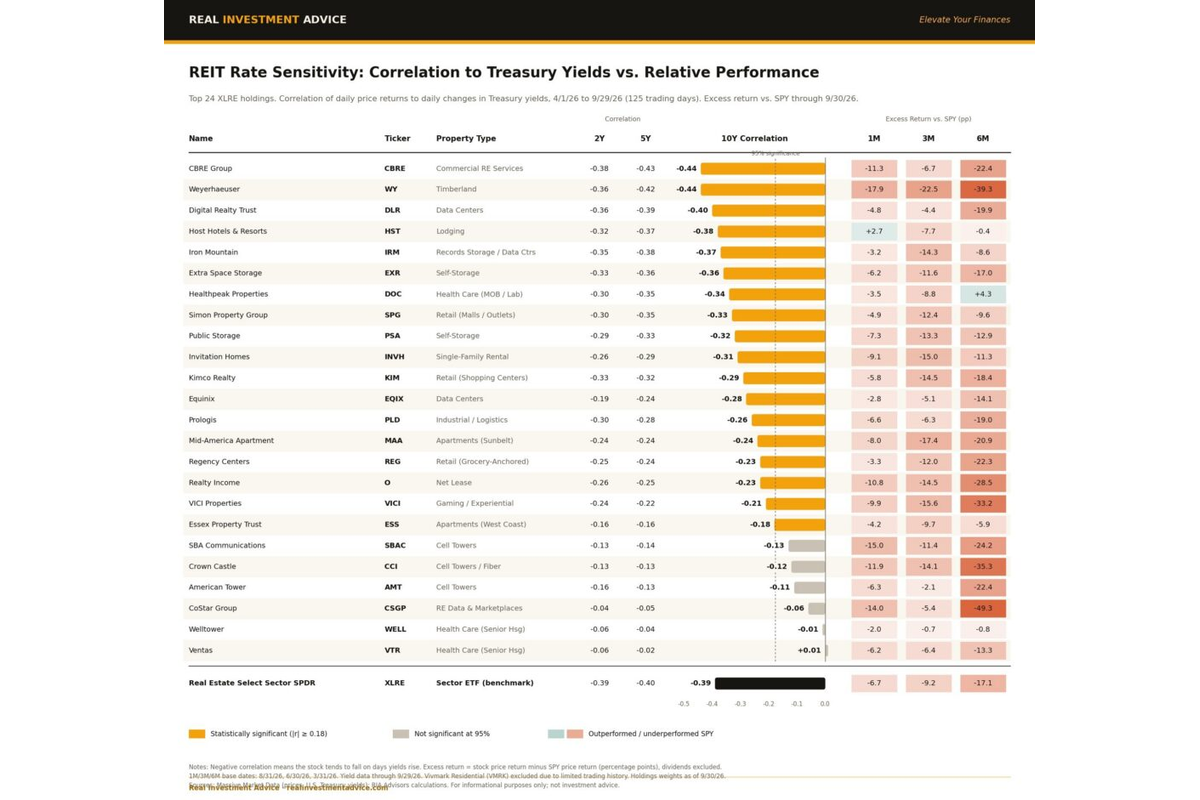
When a small number of stocks drive the index, most everything else can fall, and the index can still climb. To this point, since August 2, Nvidia has gained 6.8% and the Nasdaq 100 5.1%, while the Dow fell 4.6%, utilities 5.6%, and real estate 8.6%. The S&P is up about 1%. Those declining stocks and sectors moving against a rising index result in a negative beta.
The historical analogs give us pause. The S&P negative beta series spiked near 70 during 2000 and 2001, and the Russell measure ran above 200 in the mid-1990s and again around 1999. Both preceded a serious correction; however, neither graph shows anything alarming near the 2008 financial crisis.
The key takeaway is that index returns and the average stock’s return have come apart to an unprecedented degree. Anyone who owns stocks and assumes they represent the major market indexes may be in for a rude awakening when they read their latest brokerage statement.
What To Watch Today
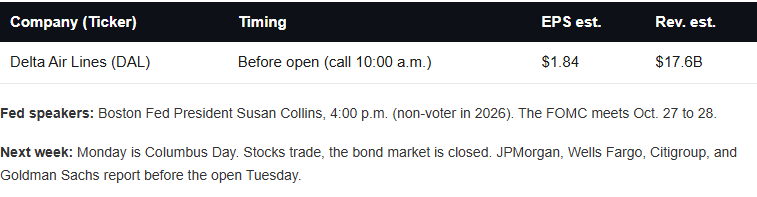
Earnings
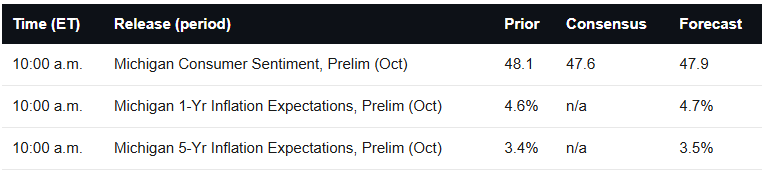
Economy
Market Trading Update
Yesterday, we checked the breadth signals across the tape and found a record standing on very few shoulders. Today, Q3 earnings season kicks off with Delta this morning and the big banks on Tuesday. The question is whether earnings can widen that foundation.
Start with the setup. Wall Street did something unusual this quarter. It raised the bar. Per FactSet, Q3 estimates rose 1.4% between June 30 and September 30, versus an average cut of 2.2% over five years and 2.5% over ten. A record 72 companies issued positive guidance, while only 44 guided lower. Analysts now expect 29.5% growth, and their bottom-up target of 9,275 sits about 18.5% above Tuesday’s record close.
Normally, the game is simple. Analysts walk estimates down, companies step over the lowered bar, and headlines cheer the “beat rate.” This time, there’s less room. When estimates rise as the season approaches, companies have to beat the higher number, not the sandbagged one.
Notice in the table below where the growth actually lives.
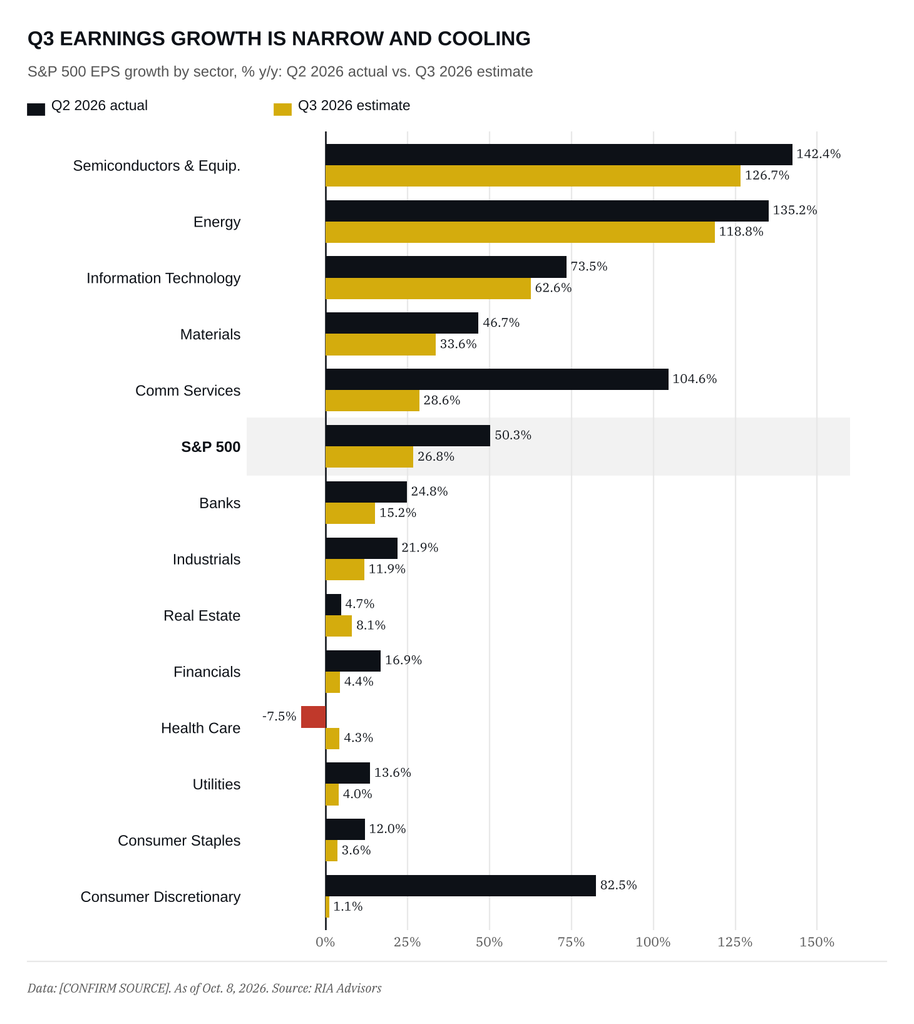
Semiconductors are expected to grow earnings by 126.7%, Energy by 118.8%, and Technology by 62.6%. Strip those out, and the picture changes. Consumer Discretionary is expected at just 1.1%, Utilities at 4.0%, Health Care at 4.3%, and Financials at 4.4%. The earnings tape looks a lot like the price tape. Narrow.
Then there’s the rate of change. Index growth slides from 50.3% in Q2 to an estimated 26.8% in Q3. Consumer Discretionary drops from 82.5% to 1.1%. Deutsche Bank’s forecast shows the same cooling in Financials, Energy, and Materials.
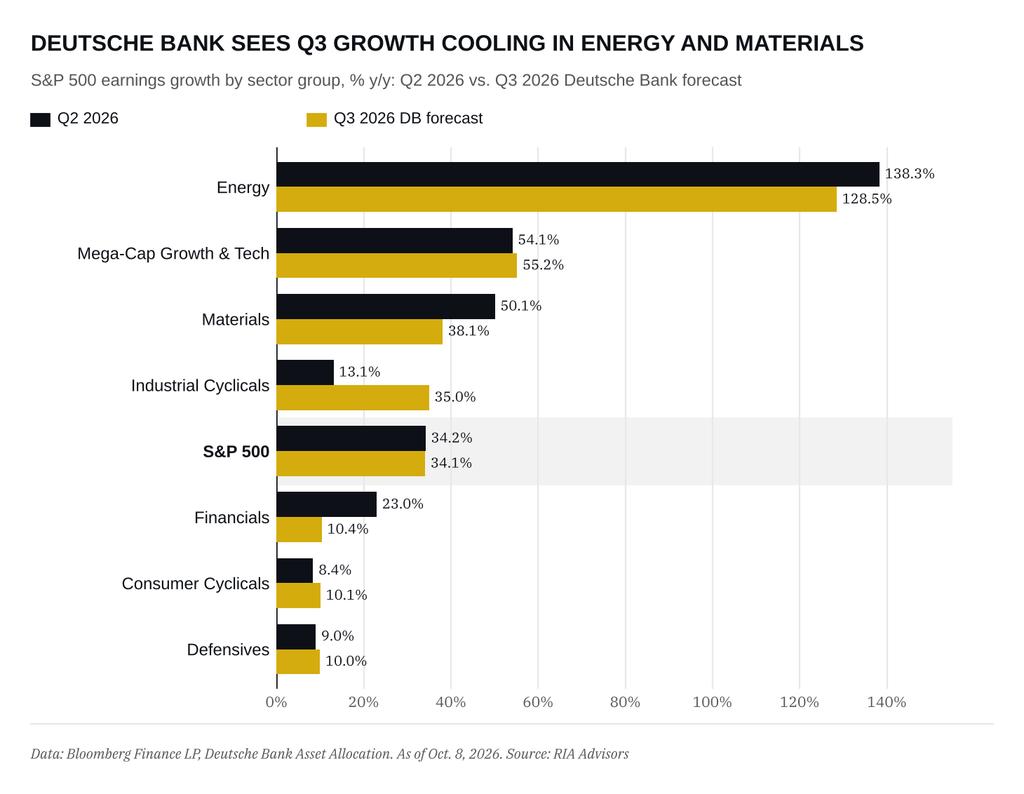
“Growth near 30% and a 19 forward multiple sounds fine to me.” Fair enough. FactSet’s 19.0 forward P/E is below its five-year average, so valuation is NOT the trap. Expectations are. Markets trade the change and growth that halves are slowing growth priced at a record. Such is the risk when everyone leans the same way.
We have recently rebalanced portfolios, completed tax-loss selling, and are positioned for a potential market rotation and the start of earnings season, with a bias towards value. Those names carry the season. Banks, expected to grow 15.2%, report Tuesday, and a clean read there would support the broadening case. A stumble by the leaders, though, hits the only part of the index doing the lifting.
The bar is always at its highest right before someone trips over it.
FOMC Minutes Show A Divided Committee
The September minutes, released Wednesday, confirm the hike was broader than the 12-0 tally suggested. All 19 participants, including the seven regional presidents who don’t vote, backed the quarter-point increase. Based on the minutes, the agreement ended there.
Reuters characterized the committee as “divided over the rationale.” Some participants saw the hike as needed to contain energy and supply shocks. A more hawkish group viewed it as insurance against demand-driven inflation. “Many participants emphasized that a higher path for the target range would be prudent on risk-management grounds,” while “several participants stated that they viewed the current policy rate as not restrictive or only mildly restrictive.”
That said, Fed members believe another hike is likely. Per the minutes, “most participants assessed that another increase in the target range for the federal funds rate would likely be appropriate by year end.”
Some participants warned that after more than five years of inflation above 2%, the elevated price growth “could begin to affect inflation expectations and wage- and price-setting decisions.” We believe this concern, as Cleveland Fed president Beth Hammack often says, is the biggest driver of hawkish policy.
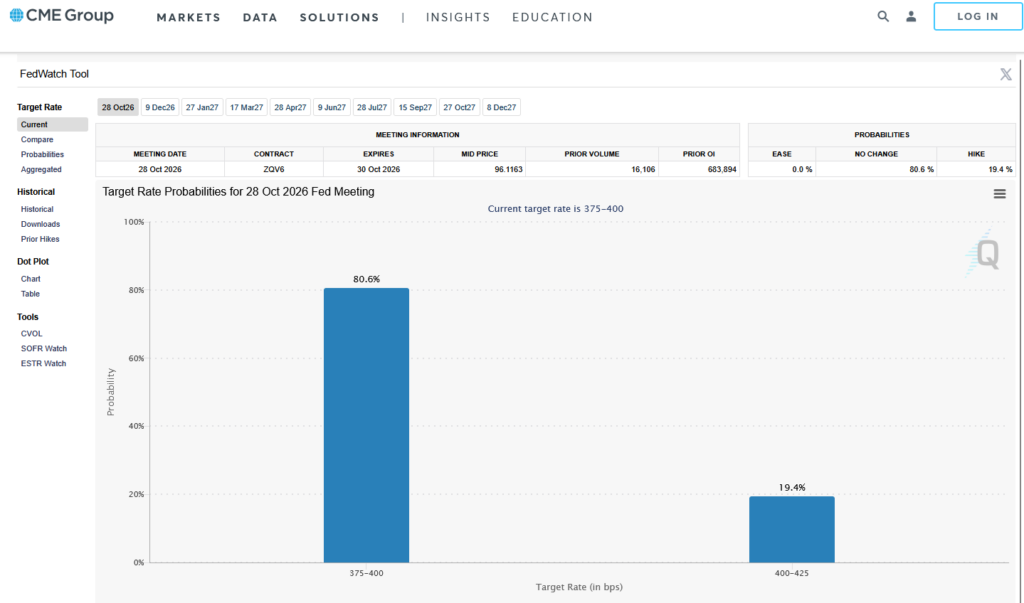
Since the meeting, inflation and employment data have deteriorated, and market odds of a Fed hike have fallen to 20%, as shown below. Last week’s core PCE was 3.0% below the 3.4% consensus, September payrolls came in at 29,000 with 60,000 of downward revisions, and unemployment rose to 4.2%.
Tweet of the Day

Comments
Log in or sign up to join the conversation.