
If you went off the grid for the last month and are just returning, you may think you missed a typical boring August. The S&P 500 is within 2% of its July 15 high, and volatility is low, as when you left a month ago. What you missed was an extreme spike in implied volatility (VIX) accompanying significant losses for some of the market’s favorite stocks.
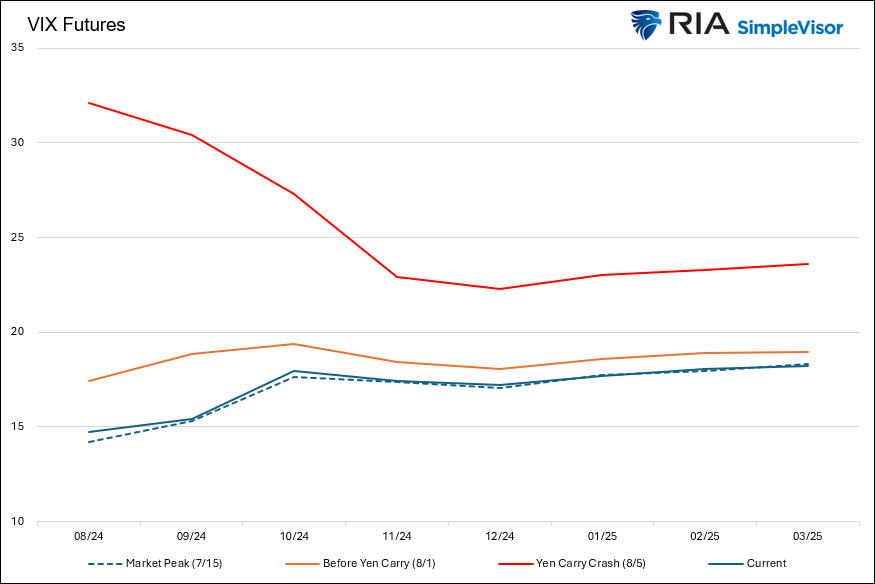
The graph below shows the extreme volatility cycle of the last month. The lines represent the VIX futures prices for each future month out to March. The current VIX curve (blue) and the one when the market peaked on July 15 (dotted blue) are virtually identical. However, the orange and red lines show the tremendous movement in the VIX curve between July 15 and today. To wit, spot VIX peaked at 39, almost 3x what it was only a few days prior. The extreme volatility of the prior few weeks is far from ordinary. Accordingly, we must be on guard for more rounds of volatility, as is typical following volatile market conditions. However, the yen-carry unwind culprit may be complete, and therefore, the spike may have been a one-off anomaly.
On a side note, it’s worth pointing out the kink in the VIX curve. The current curve shows the October VIX contract a little higher than where a linear line connecting September to November should be. This is a function of the coming election and some associated hedging. Such behavior before well-known events that could be volatile is typical.
What To Watch Today
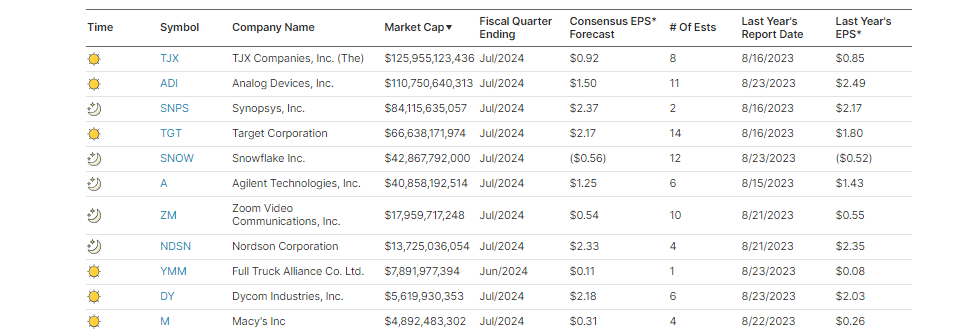
Earnings
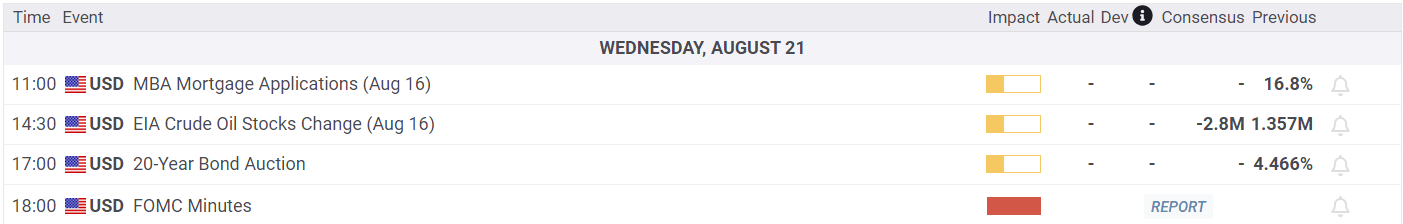
Economy
Market Trading Update
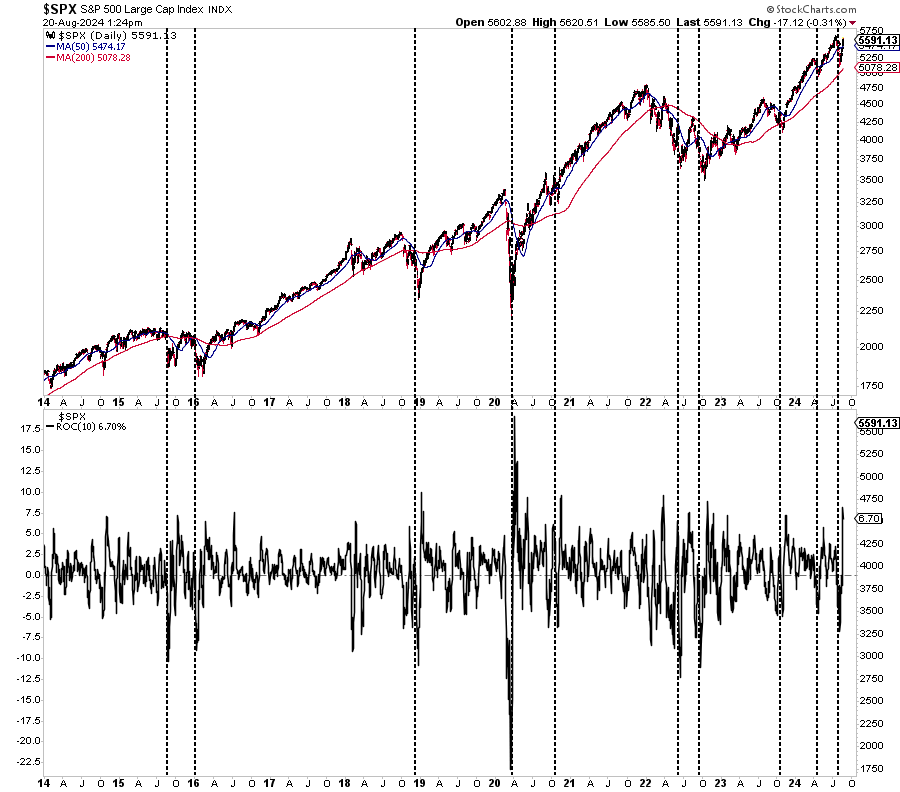
Yesterday, we discussed the rapid recovery in the markets from two weeks ago. As shown below, rapid V-shaped recoveries tend to be bullish indications of both the end of the corrective period and the resumption of the bullish trend. Since 2014, periods that saw a sharp price decline, as measured by the 10-day rate of change, followed by a sharp advance, were bullish indications. However, as seen in 2015 and 2022, such a reversal does not preclude a secondary correction from occurring.
Notably, Sentiment Trader recently did a similar study on V-shaped bottoms and concluded:
“Stocks are already overbought on some measures, and sentiment is quickly recovering from the brief freak-out a couple of weeks ago. The run has been astounding, but past performance after impressive v-shaped bottoms suggests that there should be more gains in store over the next couple of months.
The biggest caveat is that it has been exceptionally unusual to see this type of move during uptrends, and the only other times it happened, gains were capped in the weeks and months ahead. An objective look at what is inherently emotional trading behavior suggests that we should be modestly confident that this rapid shift in momentum should carry stocks even higher. However, since it’s occurring so near record highs, we shouldn’t be overly confident that we can rely on the types of gains after more protracted declines.”
We agree that the upside is likely somewhat capped, particularly with the election looming. Therefore, while there is little reason to be overly bearish, there is likewise some caution to being overly bullish. Continue to manage risk in the near term until a better entry point presents itself.
A Historic Winning Streak For The S&P 500
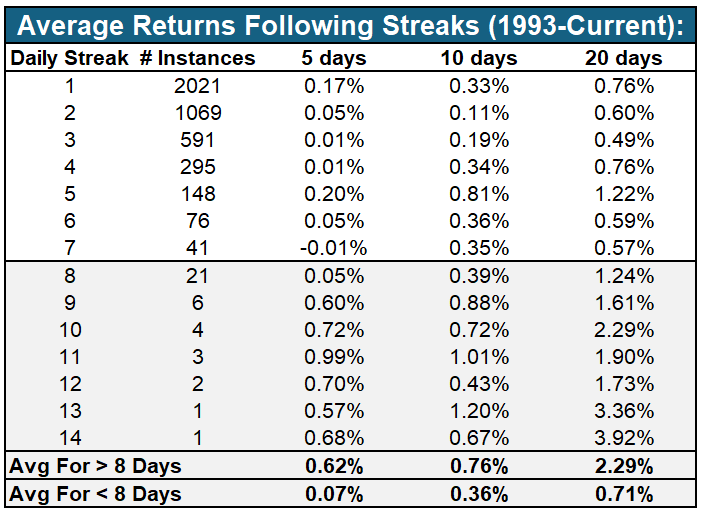
In the aftermath of early August’s extreme volatility, the S&P 500’s eight-day winning streak is nearing historic proportions. Since January 1993, there have been 7,945 trading days. Of them, only 17 days have registered a streak of 8 or more positive days. The last instance was only four months ago, in May 2024, when the S&P 500 rose for ten days straight.
So what comes next?
To help answer that, we created the table below the graph. It shows that the returns for the following 5, 10, and 20 days are, on average, following 8-day or longer streaks are much better than periods following shorter streaks.

Expected Incomes Are Concerning
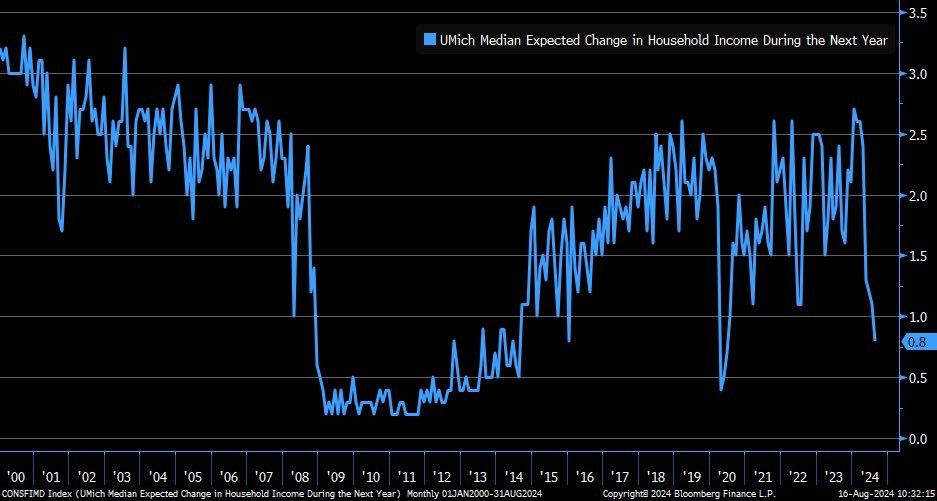
As we wrote in Confidence Is The Underappreciated Economic Engine, consumer confidence is an essential factor driving changes in economic activity. Furthermore, incomes and job security are a primary driver of confidence. Therefore, the University of Michigan sentiment chart below, which shows that the expected change in incomes in 2025 is at levels associated with prior recessions, should give us some concern. Francois Trahan posted the graph below with the following commentary:
I try to not make too much from one series, but this series is not looking good. It’s from the University of Michigan survey of confidence and measures income expectations. It’s rarely been this bad, and markets certainly don’t jive with the other two times it plunged like this.
Tweet of the Day
More By This Author:
Price Gouging For Food: Reality Or Campaign Rhetoric?Market Decline Over As Investors Buy The Dip
Oil And Bond Yields Are Tied At The Hip


Comments
Log in or sign up to join the conversation.