Putting The Pedal To The Metal: The S&P Global Core Battery Metals Index
While electric vehicles have been attractive to environmentally conscious consumers for several decades, in recent years, they have come into their own as innovation has made them more accessible and practical. With the current prices at the pump, now more than ever, consumers are turning to electric vehicles as a greener and more economical option. As Exhibit 1 shows, sales of “plug-in” electric vehicles are expected to grow significantly through 2026. As demand for electric vehicles and other technologies strengthens, so does the need for rechargeable batteries.

Booming Battery Metals Markets
Considering the current and anticipated demand for rechargeable batteries, markets for their input commodities have been booming. For market participants seeking to participate in this trend, S&P Dow Jones Indices (S&P DJI) recently launched the S&P Global Core Battery Metals Index. The index seeks to track global companies engaged in producing and mining three core battery metals: cobalt, lithium and nickel.
Partnership with S&P Global Commodity Insights
To develop this index, S&P DJI partnered with S&P Global Commodity Insights (S&P GCI). Given their expertise in metals and mining, S&P GCI played a significant role in defining the rules of the index.
They identified cobalt, lithium and nickel as the three core battery metals that the index would track via producing companies. These metals were selected since they are typically the key metals used in active cathode materials deployed in high-performance batteries.
To accurately capture the battery metals’ production values, the index sources data from S&P GCI’s Metals and Mining dataset. Provided via the S&P Capital IQ Pro platform, this industry-leading dataset includes over 4,500 mining companies and over 37,000 mining properties.
Methodology Overview
To be eligible for inclusion, companies must be a member of the S&P Global BMI. Additionally, companies must have been a producer of either cobalt, lithium or nickel for the previous year (as measured by S&P GCI’s Metals and Mining Dataset). All eligible companies are included in the index.
Qualifying companies are weighted proportionately to their production-value-to-revenue ratio. To calculate this ratio, the sum of the production value across the three battery metals is divided by the revenue from the previous year (in USD). Constituents are then ranked in ascending order so that the companies with the highest proportion of battery metal production are given the largest rank. Each company’s final weight is calculated by its rank divided by the sum of all ranks (subject to liquidity capping). In this way, the index overweights companies where the production of these core battery metals represents a significant portion of their business.
Statistical Analysis
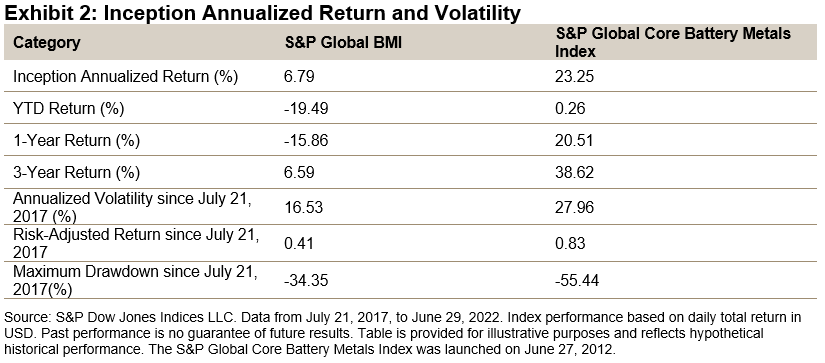
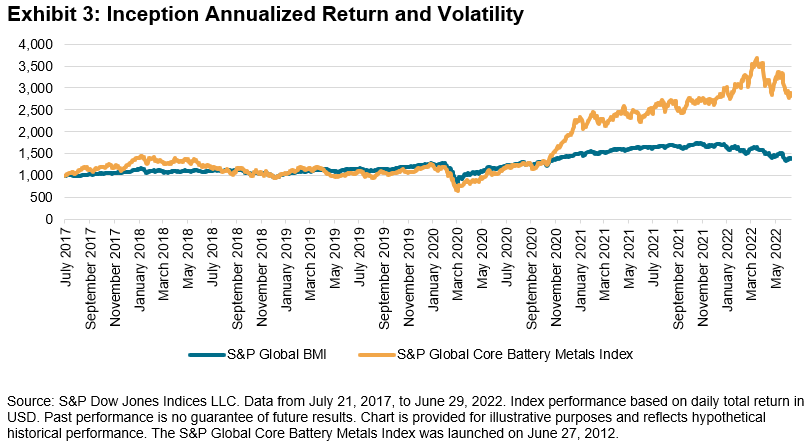
The first value date for the S&P Global Core Battery Metals Index was set as July 21, 2017, when enough companies were represented in the dataset. Since then, the index has earned an annualized return of 23.25%, outperforming its benchmark by almost 16.5%. Most of this outperformance was achieved in the last couple of years on the back of the booming metals markets.


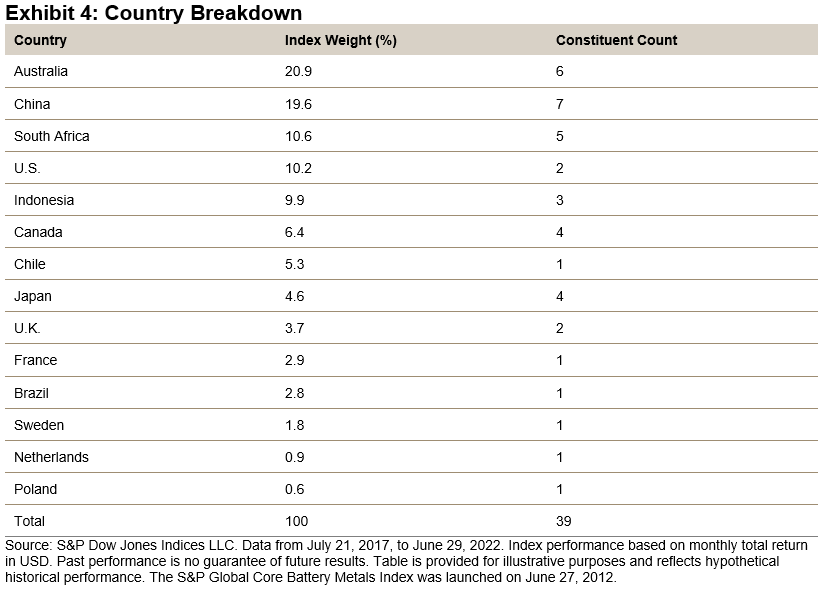
Let’s now examine the country breakdown for the S&P Global Core Battery Metals Index. As one might expect, the index weighs heavily toward Australia and China, the two top-producing countries for battery raw materials. However, the index has a strong representation across over a dozen counties (see Exhibit 4).

In two subsequent blogs, we will further explore the methodological details and index characteristics. In fact, our colleagues at S&P GCI will author the next blog, focusing on the Metals and Mining dataset that the index leverages to source battery metals’ production values. Stay tuned!
More By This Author:
Commodities Hit the Brakes in JuneThe S&P ESG Dividend Aristocrats Index Series: One Year Later
Simplicity Yields Outperformance: The S&P 500 Low Volatility High Dividend Index
Disclaimer: See the full disclaimer for S&P Dow Jones Indices here.


