Oil, Risk, And Price Pressures Before Putin/Ukraine – Using The Hamilton Filter
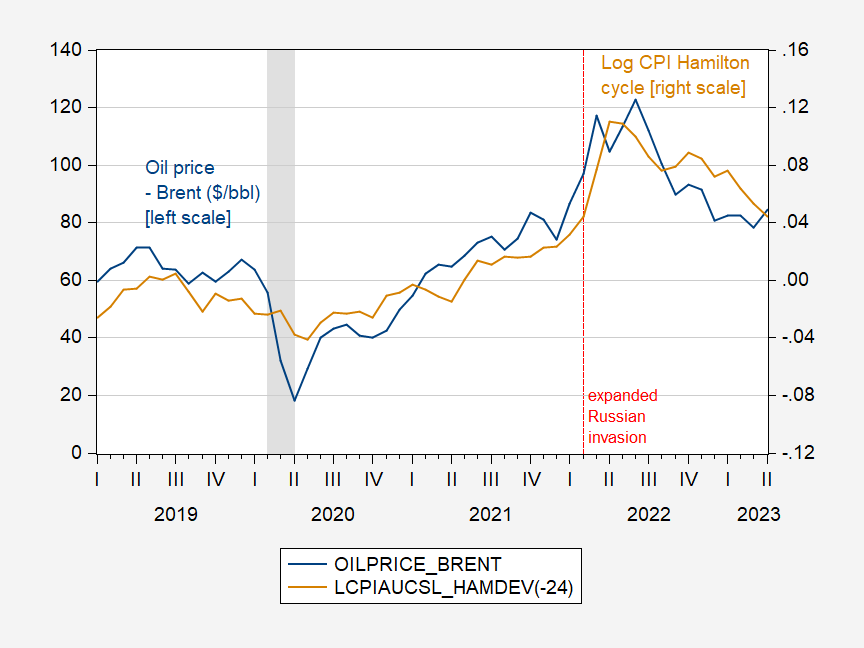
Reader Erik Poole suggests using the Hamilton filter instead of the Hodrick-Prescott filter, in assessing how much the CPI deviated from trend (recall, I noted that the CPI rose 2% vs trend at the same time as oil prices were elevated, before and after the expanded Russian invasion of Ukraine). I am (more than) happy to oblige.

Figure 1: Oil price (Brent), $/bbl (blue, left scale), and CPI deviation from trend (Hamilton filter) (tan, right scale). NBER defined peak-to-trough recession dates shaded gray. Source: EIA, BLS via FRED, NBER, and author’s calculations.
I implemented the Hamilton filter with h=24, p=12. The HP cyclical component rose 2.1% from November 2011 to June 2022, while the Hamilton filter indicates a 7.7% increase. This is in line with my conjecture that in general, estimated cyclical components were larger for most typical US macro series.
Obviously, correlation is not causation; in particular, a joint factor is that increased oil prices are associated with increased aggregate demand, which itself (in the context of fixed or depressed aggregate supply) would raise prices via the simple Phillips Curve. However, I think all would agree at least a large share of the energy component of CPI-all is associated with cost-push inflationary pressures.
More By This Author:
Oil, Risk, And Price Pressures Before Putin/UkraineReal Median And Average Earnings, Normalized To NBER Peak
Timely Data On Median Wages


