
It’s important to recall, especially as some nowcasts suggest a negative reading for Q2 growth, that GDP numbers are revised. The first release is called an “advance” release because a substantial share of the inputs are estimated. Below are the various vintages of GDP, starting after the trough so as to better highlight recent revisions.
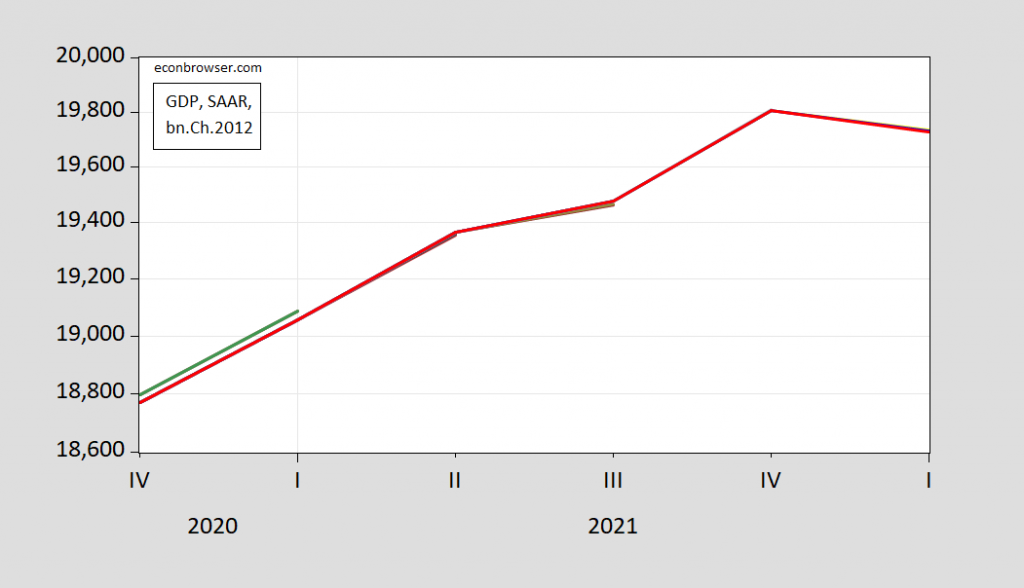
Figure 1: GDP, various vintages, in billions Ch.2012$ SAAR. Source: BEA via AFRED.
The errors between advance and third release are shown in Figure 2 (in log differences; hence 0.0002 indicates a .02% revision).
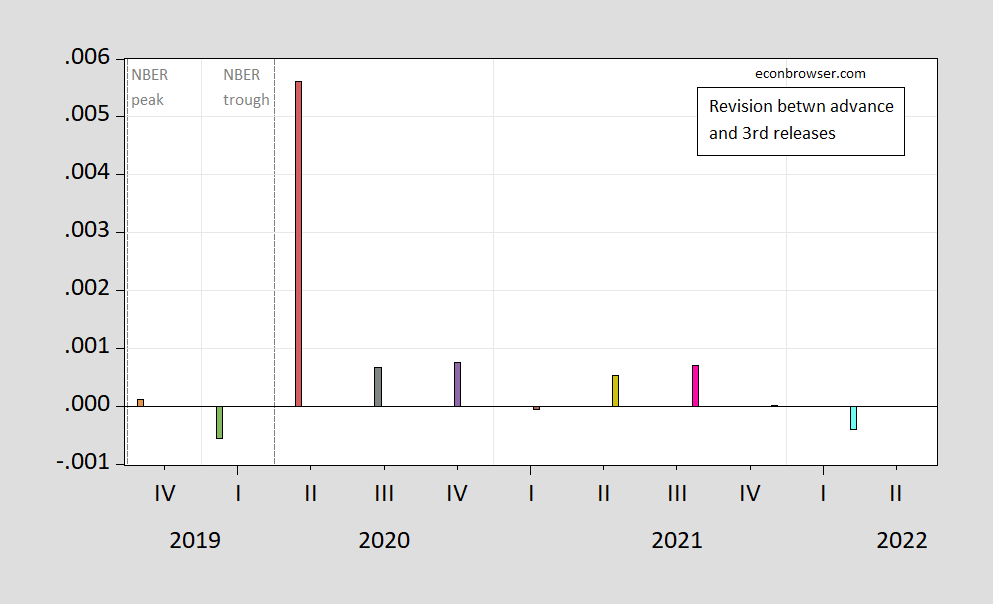
Figure 2: Revisions between advance and 3rd release, in log terms. Source: BEA, author’s calculations.
There are always revisions. A previous discussion of G-7 GDP revisions is here. Clearly, contra earlier studies, these revisions tend to be positive, although whether the difference is statistically significant is something I haven’t checked.
Notice that there was a huge positive revision going from advance to third release in 2020Q2 — over half a percentage point, in log terms. This is understandable given the turmoil associated with this period. However, the fact there was an enormous drop in 2020Q2 GDP brings up the issue of dealing with seasonality in the wake of that quarter. This is not an issue unknown to statisticians — see Lucca and Wright (2021) as well as BLS (2022).
This brings us back to what different seasonal adjustment approaches show us. Figure 3 shows the official BEA series, the official seasonally unadjusted series (all the latest vintages), and my ad hoc seasonal adjusted series, using the 2002-2022Q1 period, Census X-13 with log transform and an additional outlier for 2020Q2.
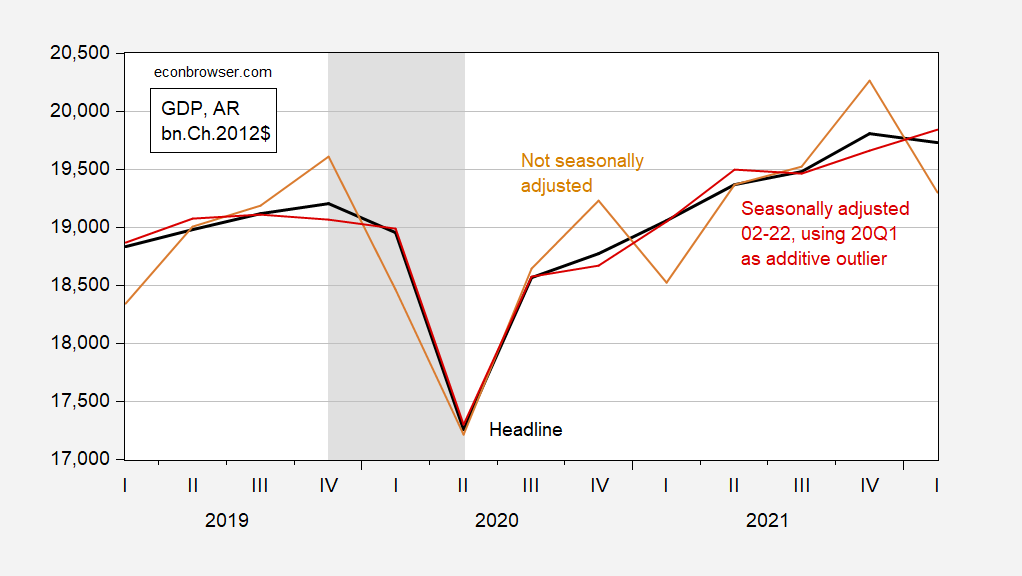
Figure 3: GDP, seasonally adjusted as reported by BEA (bold black), not seasonally adjusted (tan), and seasonally adjusted using X-13, log transform, allowing for additional outlier at 2020Q2 (red). NBER defined peak-to-trough recession dates shaded gray. Source: BEA, NBER, and author’s calculations.
Note that my seasonal adjustment process is not going to replicate the BEA’s. BEA applies seasonal adjustment to entire sample of individual components before summing. I’ve applied a seasonal adjustment filter to the aggregate series over 2002-22, the period for which I have nsadata. Hence, my point here is not to argue GDP growth is more properly measured as positive in Q1; rather it’s to highlight the pitfalls of over-interpreting the advance release on a q/q basis. (In fact, come July 28, estimates for 2022Q1 will be revised in the annual benchmark revision.)
More By This Author:
One Year Treasurys and One Year ForwardsBusiness Cycle Indicators
Term Spread Models for Recession by June 2023


Comments
Log in or sign up to join the conversation.