Business Cycle Indicators
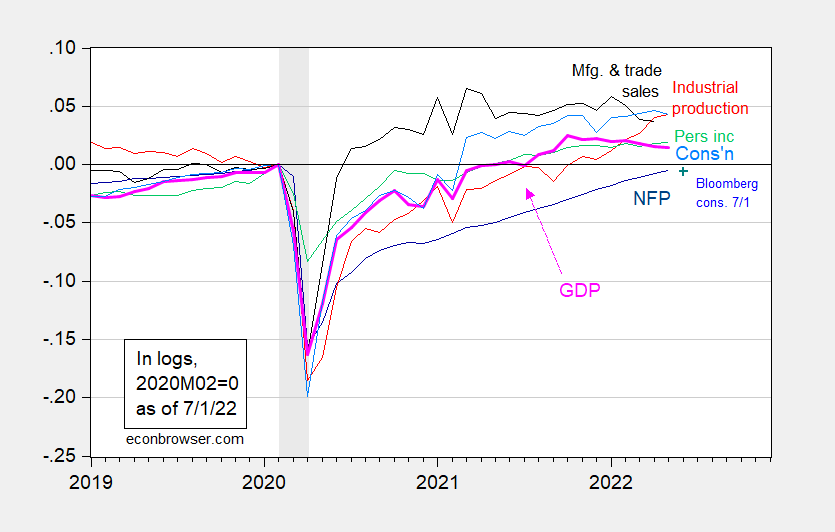
IHS-Markit’s monthly GDP is now down seven months. Some key indicators followed by NBER BCDC:

Figure 1: Nonfarm payroll employment (dark blue), Bloomberg consensus for NFP (blue +), industrial production (red), personal income excluding transfers in Ch.2012$ (green), manufacturing and trade sales in Ch.2012$ (black), consumption in Ch.2012$ (light blue), and monthly GDP in Ch.2012$ (pink), all log normalized to 2020M02=0. NBER defined recession dates, peak-to-trough, shaded gray. Source: BLS, Federal Reserve, BEA, via FRED, IHS Markit (nee Macroeconomic Advisers) (7/1/2022 release), NBER, and author’s calculations.
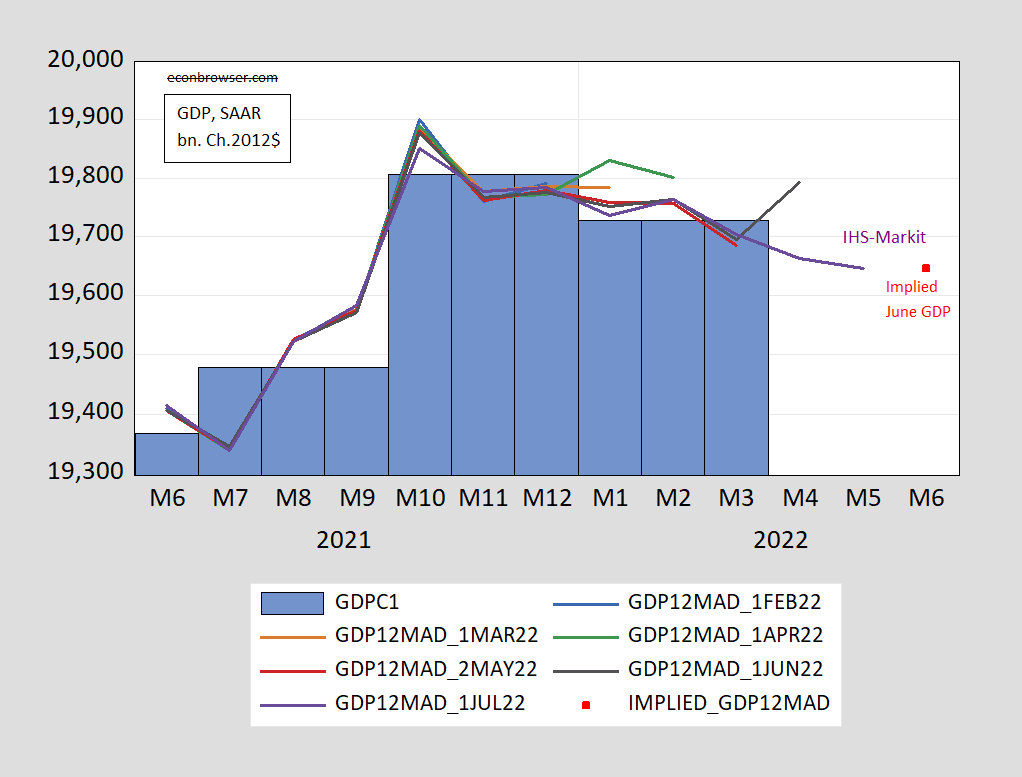
We now have two out of five key indicators falling in May. Monthly GDP is down for seven months. Figure 2 shows the path of monthly GDP according to various vintages,

Figure 2: Official GDP (blue bar), IHS-Markit monthly GDP (lines), implied IHS-Markit June 2022 monthly GDP (red square), all in billions Ch.2012$ SAAR. Source: BEA Q1 3rd release, IHS Markit various releases.
Notice the variation in estimates of monthly GDP.
IHS-Markit notes in today’s Weekly Commentary:
We estimate that GDP fell in both the first and second quarters at nearly identical rates. The Bureau of Economic Analysis estimated that GDP fell at a 1.6% pace in the first quarter; we estimate, following the latest monthly data on international trade, consumer spending, inventories, and other sources, that GDP fell at a 1.5% rate in the second quarter. A two-quarter decline in GDP meets the popular definition of recession. However, the first half was not as weak as portrayed in the GDP figures (including our estimate for the second quarter) and we think it unlikely that the official arbiter, the NBER Business Cycle Dating Committee, would deem the estimated declines in GDP in the first and second quarters as satisfying their definition of a recession that involves “a significant decline in economic activity that is spread across the economy and lasts more than a few months.”
Disclosure: None.


