
March ISM Manufacturing Index: Expansion Continues
Friday morning the Institute for Supply Management published its monthly Manufacturing Report for March. The latest headline Purchasing Managers Index (PMI) was 57.1, a decrease of 1.5 from 58.6 the previous month and in expansion territory. Today's headline number was below the Investing.com forecast of 59.0.
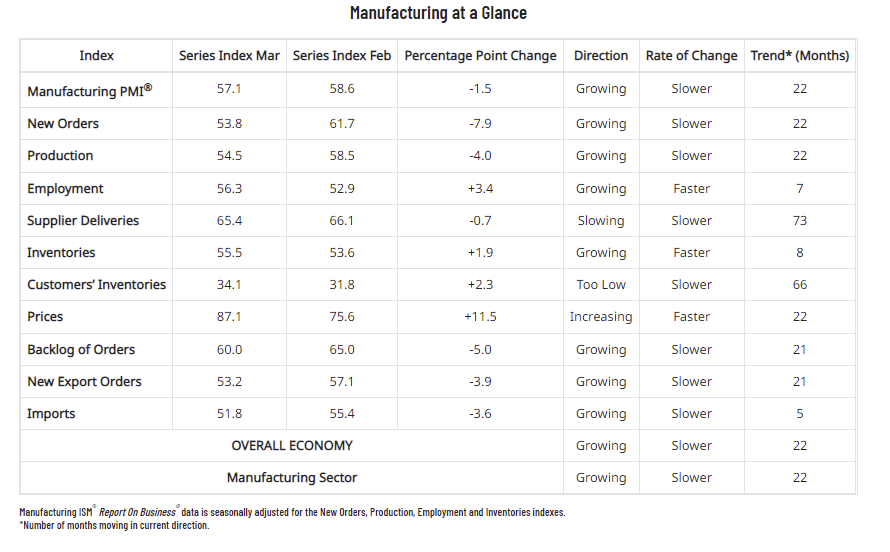
Here is the key analysis from the report:
The report was issued today by Timothy R. Fiore, CPSM, C.P.M., Chair of the Institute for Supply Management® (ISM®) Manufacturing Business Survey Committee:
“The March Manufacturing PMI® registered 57.1 percent, a decrease of 1.5 percentage points from the February reading of 58.6 percent. This figure indicates expansion in the overall economy for the 22nd month in a row after a contraction in April and May 2020. This is the lowest reading since September 2020 (55.4 percent). The New Orders Index registered 53.8 percent, down 7.9 percentage points compared to the February reading of 61.7 percent. The Production Index reading of 54.5 percent is a 4-percentage point decrease compared to February’s figure of 58.5 percent. The Prices Index registered 87.1 percent, up 11.5 percentage points compared to the February figure of 75.6 percent. The Backlog of Orders Index registered 60 percent, 5 percentage points lower than the February reading of 65 percent. The Employment Index figure of 56.3 percent is 3.4 percentage points higher than the 52.9 percent recorded in February. The Supplier Deliveries Index registered 65.4 percent, a decrease of 0.7 percentage point compared to the February figure of 66.1 percent. The Inventories Index registered 55.5 percent, 1.9 percentage points higher than the February reading of 53.6 percent. The New Export Orders Index reading of 53.2 percent is down 3.9 percentage points compared to February’s figure of 57.1 percent. The Imports Index registered 51.8 percent, a 3.6-percentage point decrease from the February reading of 55.4 percent.” See report
Here is the table of PMI components.
The chart below shows the Manufacturing Composite series, which stretches back to 1948. The eleven recessions during this time frame are indicated along with the index value the month before the recession starts.
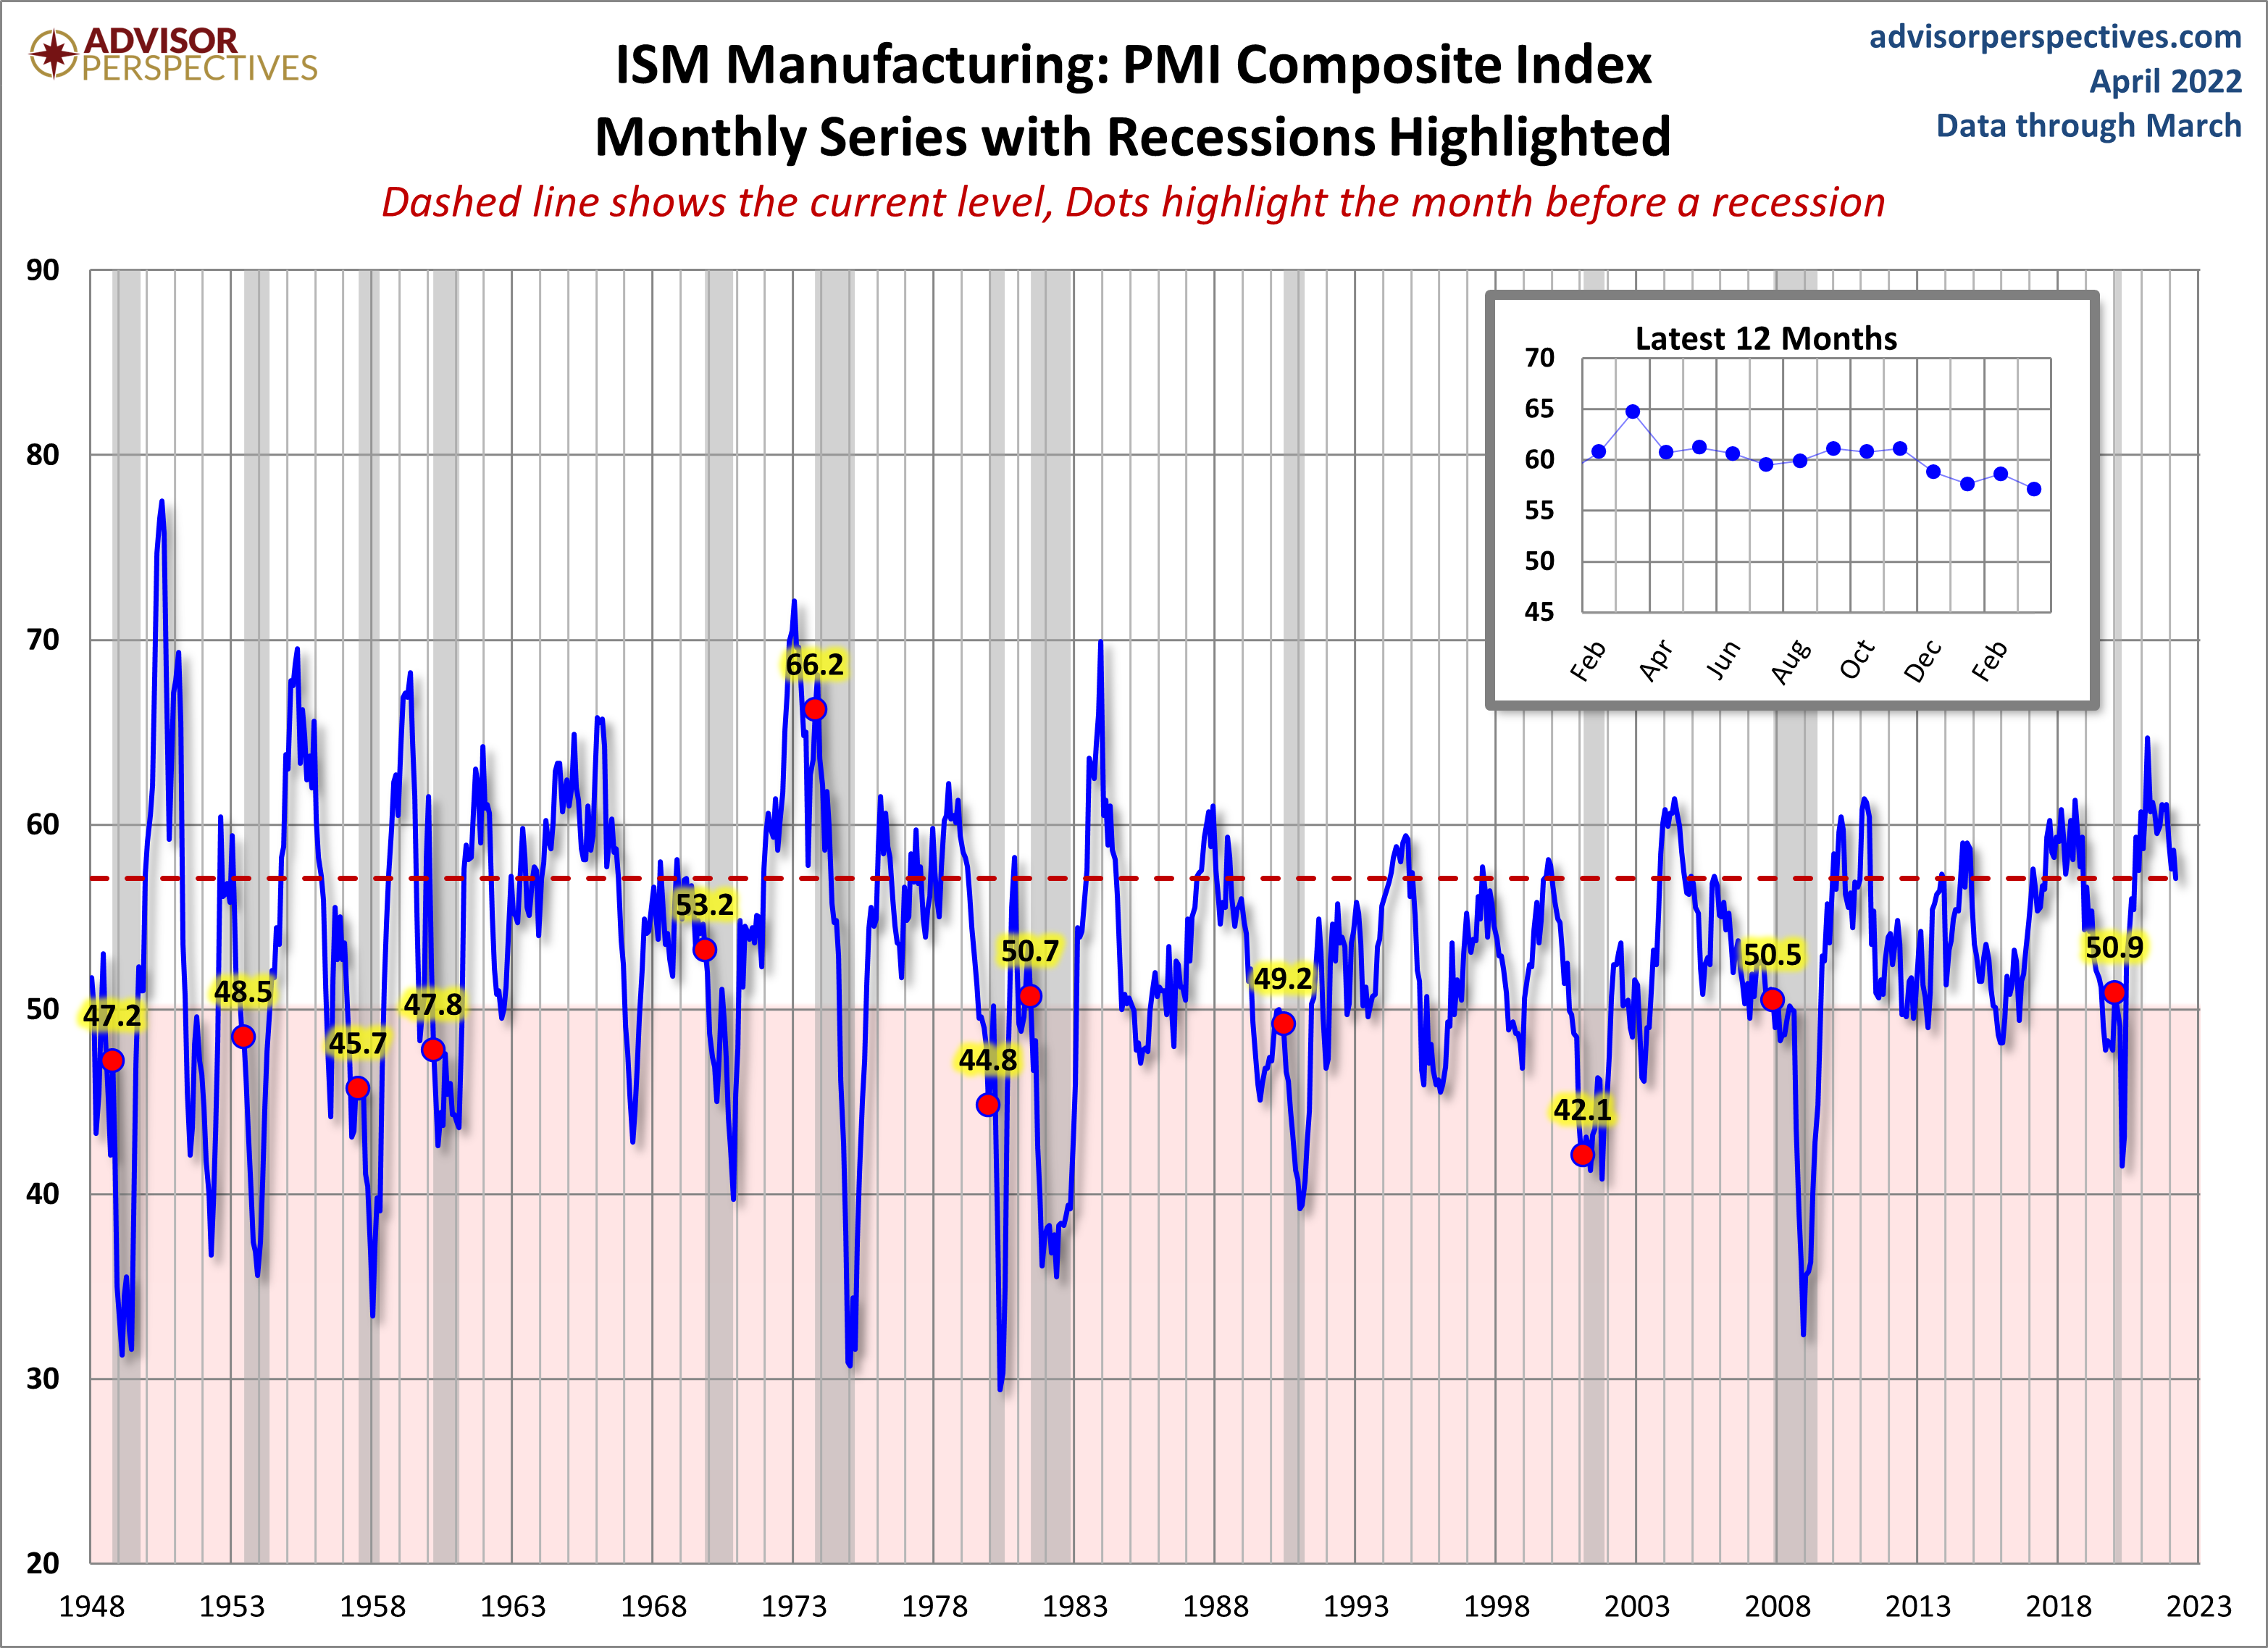
For a diffusion index, the latest reading is 57.1 and indicates expansion. What sort of correlation does that have with the months before the start of recessions? Check out the red dots in the chart above.
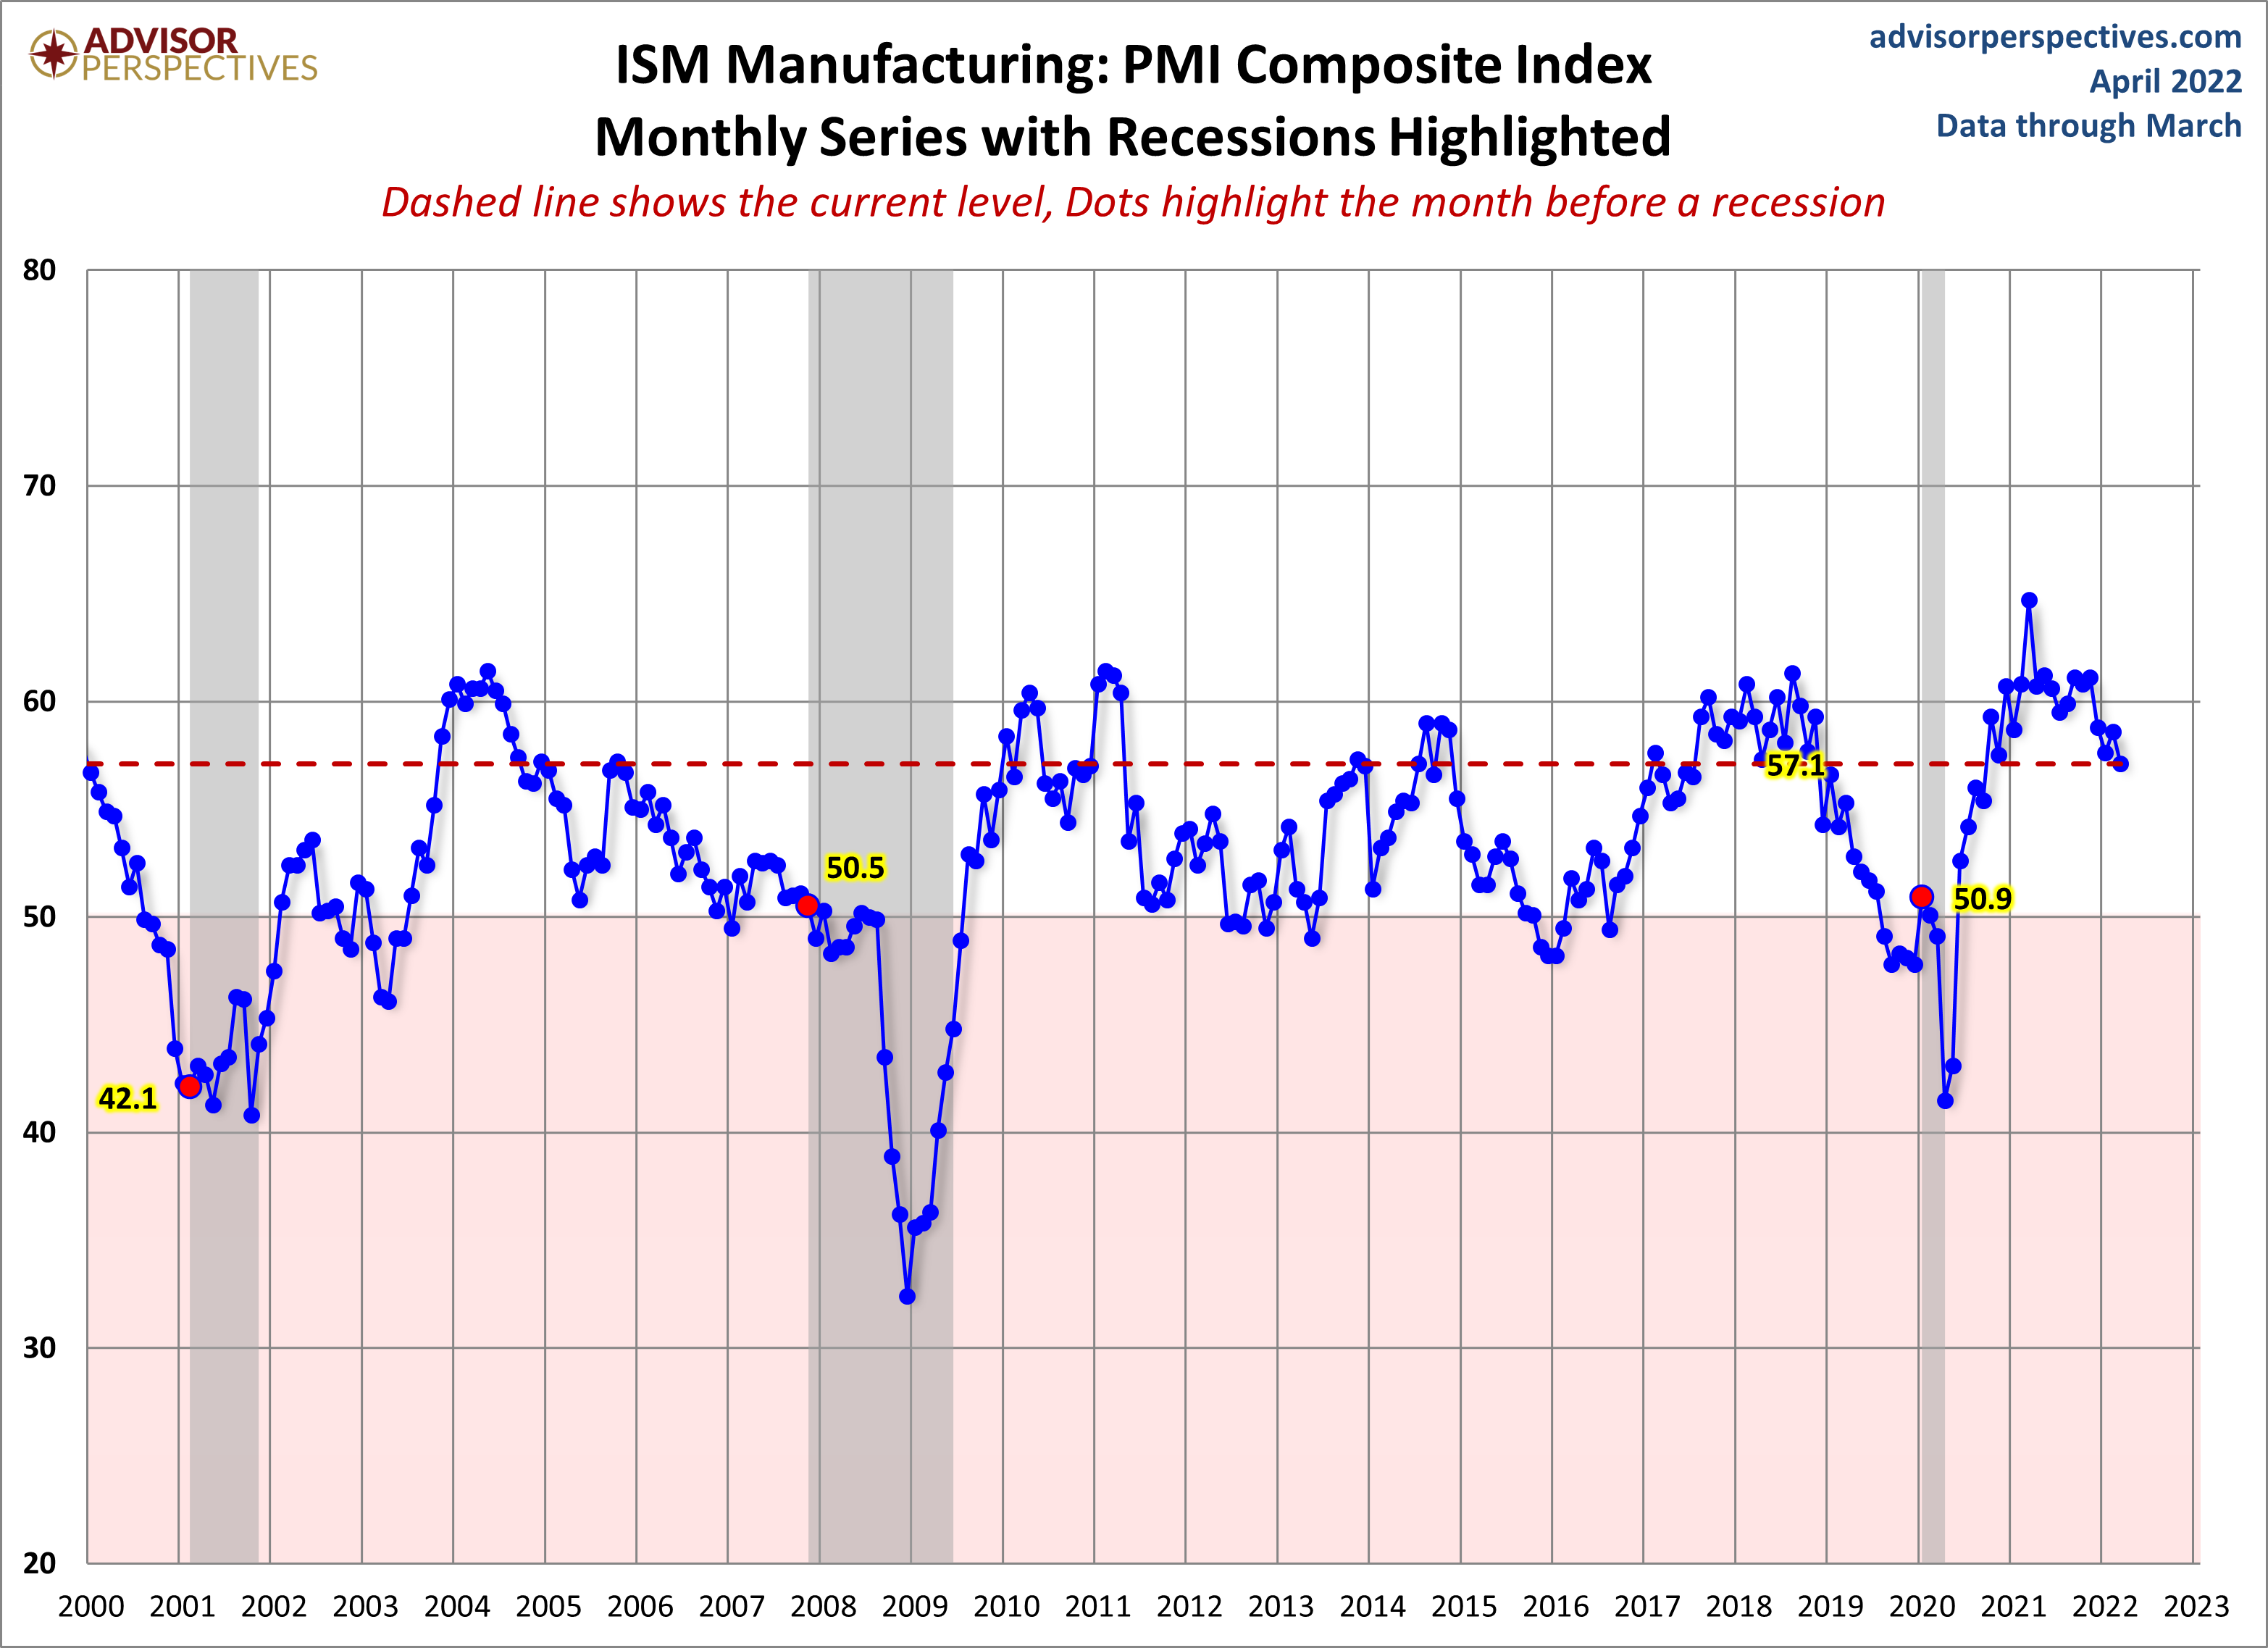
Here is a closer look at the series beginning at the turn of the century.
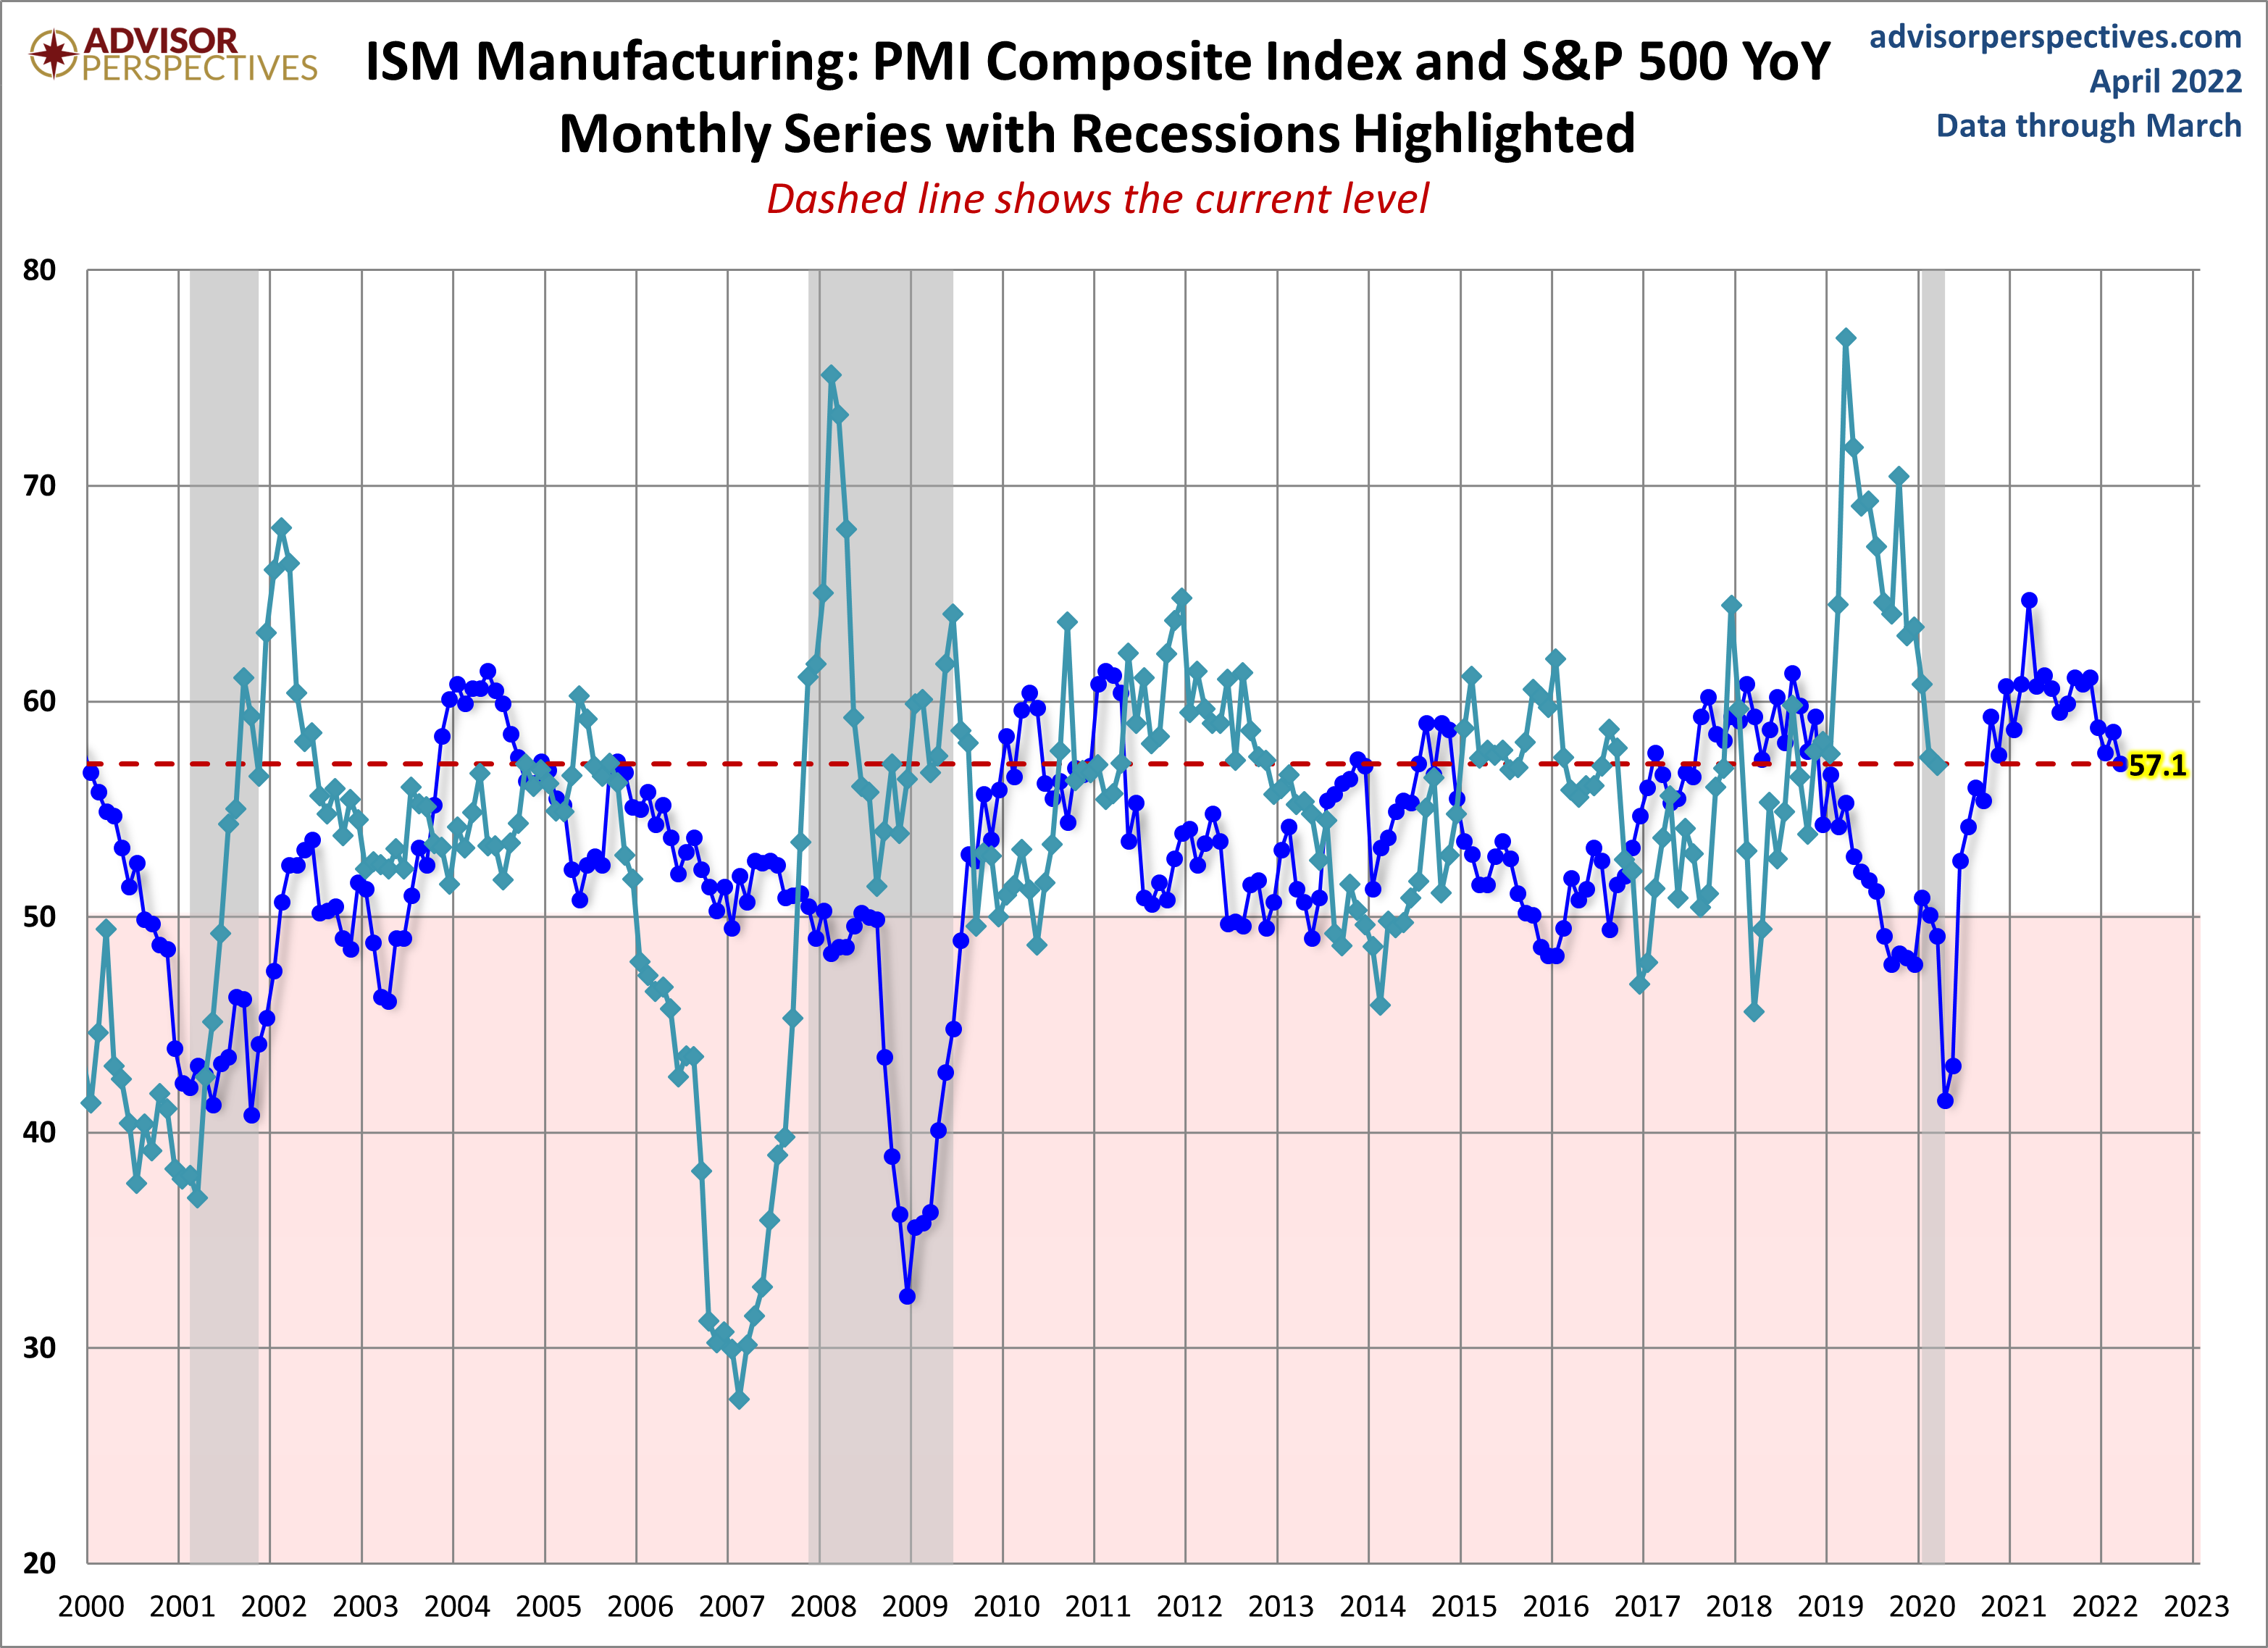
Lastly, here's a comparison of the ISM Manufacturing PMI and the S&P 500 YoY.
Note: This commentary used the FRED USRECP series (Peak through the Period preceding the Trough) to highlight the recessions in the charts above. For example, the NBER dates the last cycle peak as December 2007, the trough as June 2009 and the duration as 18 months. The USRECP series thus flags December 2007 as the start of the recession and May 2009 as the last month of the recession, giving us the 18-month duration. The dot for the last recession in the charts above is thus for November 2007. The "Peak through the Period preceding the Trough" series is the one FRED uses in its monthly charts, as illustrated here.


