
Here are the latest charts and statistics for the Commitment of Traders (COT) data published by the Commodities Futures Trading Commission (CFTC).
The latest COT data is updated through Tuesday July 19th and shows a quick view of how large traders (for-profit speculators and commercial entities) were positioned in the futures markets.
Weekly Speculator Changes
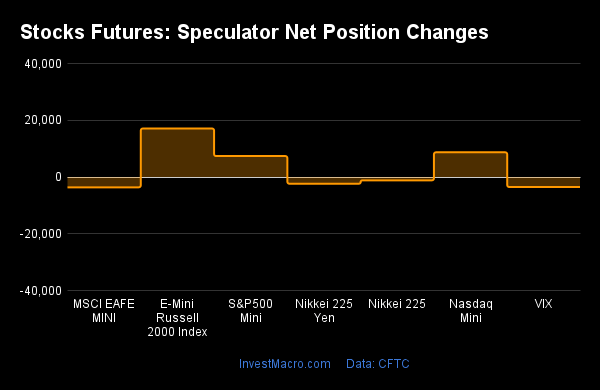
COT stock market speculator bets were mostly higher this week as five out of the seven stock markets we cover had higher positioning this week while the other three markets had lower contracts.
Leading the weekly gains for stock markets was Russell 2000 Mini (17,089 contracts) with the Nasdaq Mini (8,701 contracts), S&P500 Mini (7,380 contracts) and the Dow Jones Industrial Average Mini (4,006 contracts) also showing positive weeks.
The stock markets leading the declines in speculator bets this week were MSCI EAFE Mini (-3,637 contracts) with VIX (-3,533 contracts) and Nikkei 225 USD (-1,176 contracts) also registering lower bets on the week.
Data Snapshot of Stock Market Traders | Columns Legend
| S&P500-Mini | 2,335,319 | 9 | -208,148 | 18 | 266,346 | 100 | -58,198 | 14 |
| VIX | 308,124 | 29 | -69,900 | 74 | 76,077 | 26 | -6,177 | 61 |
| Nasdaq-Mini | 256,388 | 46 | 28,117 | 91 | -19,555 | 14 | -8,562 | 31 |
| DowJones-Mini | 71,277 | 30 | -15,837 | 16 | 20,984 | 88 | -5,147 | 11 |
| Nikkei 225 Yen | 64,010 | 49 | 5,177 | 50 | 25,668 | 89 | -30,845 | 11 |
| Nikkei 225 | 13,324 | 7 | -3,127 | 63 | 3,341 | 46 | -214 | 26 |
Strength Scores
Strength Scores (a normalized measure of Speculator positions over a 3-Year range, from 0 to 100 where above 80 is extreme bullish and below 20 is extreme bearish) show that the Nasdaq-Mini (90.7 percent) lead the stocks is currently in a bullish extreme level. The VIX (74.2 percent) and the Nikkei USD (62.6 percent) comes in as the next highest stock markets in strength scores. On the downside, the EAFE-Mini (8.5 percent) comes in at the lowest strength level currently and is followed by the Russell 2000-Mini (10.1 percent), the DowJones-Mini (16.1 percent) and the S&P500-Mini (17.6 percent). All four of those markets are in bearish extreme levels at the moment (below 20 percent).

Strength Statistics:
VIX (74.2 percent) vs VIX previous week (76.0 percent)
S&P500-Mini (17.6 percent) vs S&P500-Mini previous week (16.3 percent)
DowJones-Mini (16.1 percent) vs DowJones-Mini previous week (11.1 percent)
Nasdaq-Mini (90.7 percent) vs Nasdaq-Mini previous week (85.9 percent)
Russell2000-Mini (10.1 percent) vs Russell2000-Mini previous week (0.5 percent)
Nikkei USD (62.6 percent) vs Nikkei USD previous week (68.2 percent)
EAFE-Mini (8.5 percent) vs EAFE-Mini previous week (12.6 percent)
Strength Trends
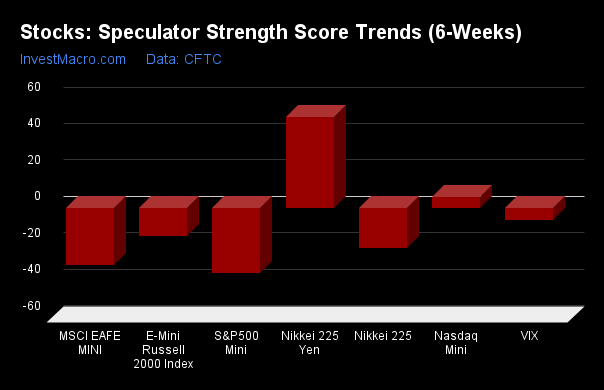
Strength Score Trends (or move index, calculates the 6-week changes in strength scores) show that the Nasdaq-Mini (6.2 percent) and DowJones-Mini (5.7 percent) lead the past six weeks trends for stocks this week. The S&P500-Mini (-35.4 percent) leads the downside trend scores currently while the next market with lower trend scores were the EAFE-Mini (-30.9 percent) followed by the Nikkei USD (-21.8 percent).
Strength Trend Statistics:
VIX (-6.3 percent) vs VIX previous week (-10.8 percent)
S&P500-Mini (-35.4 percent) vs S&P500-Mini previous week (-44.0 percent)
DowJones-Mini (5.7 percent) vs DowJones-Mini previous week (7.8 percent)
Nasdaq-Mini (6.2 percent) vs Nasdaq-Mini previous week (7.7 percent)
Russell2000-Mini (-15.3 percent) vs Russell2000-Mini previous week (-22.2 percent)
Nikkei USD (-21.8 percent) vs Nikkei USD previous week (5.4 percent)
EAFE-Mini (-30.9 percent) vs EAFE-Mini previous week (-20.7 percent)
Individual Markets:
VIX Volatility Futures:
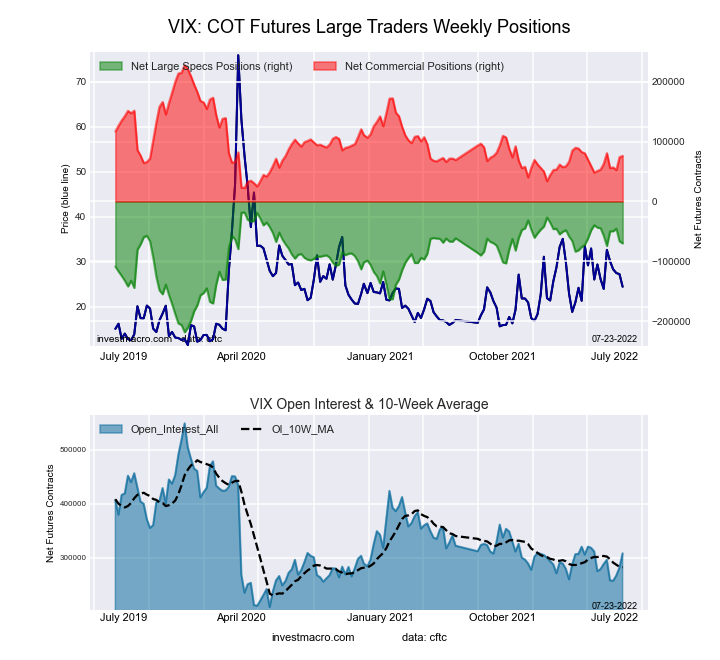
The VIX Volatility large speculator standing this week equaled a net position of -69,900 contracts in the data reported through Tuesday. This was a weekly decline of -3,533 contracts from the previous week which had a total of -66,367 net contracts.
This week’s current strength score (the trader positioning range over the past three years, measured from 0 to 100) shows the speculators are currently Bullish with a score of 74.2 percent. The commercials are Bearish with a score of 26.1 percent and the small traders (not shown in chart) are Bullish with a score of 61.4 percent.
| VIX Volatility Futures Statistics | SPECULATORS | COMMERCIALS | SMALL TRADERS |
| – Percent of Open Interest Longs: | 15.5 | 56.8 | 7.9 |
| – Percent of Open Interest Shorts: | 38.2 | 32.1 | 9.9 |
| – Net Position: | -69,900 | 76,077 | -6,177 |
| – Gross Longs: | 47,762 | 175,043 | 24,318 |
| – Gross Shorts: | 117,662 | 98,966 | 30,495 |
| – Long to Short Ratio: | 0.4 to 1 | 1.8 to 1 | 0.8 to 1 |
| NET POSITION TREND: | |||
| – Strength Index Score (3 Year Range Pct): | 74.2 | 26.1 | 61.4 |
| – Strength Index Reading (3 Year Range): | Bullish | Bearish | Bullish |
| NET POSITION MOVEMENT INDEX: | |||
| – 6-Week Change in Strength Index: | -6.3 | 6.4 | -2.4 |
S&P500 Mini Futures:

The S&P500 Mini large speculator standing this week equaled a net position of -208,148 contracts in the data reported through Tuesday. This was a weekly boost of 7,380 contracts from the previous week which had a total of -215,528 net contracts.
This week’s current strength score (the trader positioning range over the past three years, measured from 0 to 100) shows the speculators are currently Bearish-Extreme with a score of 17.6 percent. The commercials are Bullish-Extreme with a score of 100.0 percent and the small traders (not shown in chart) are Bearish-Extreme with a score of 14.2 percent.
| S&P500 Mini Futures Statistics | SPECULATORS | COMMERCIALS | SMALL TRADERS |
| – Percent of Open Interest Longs: | 10.7 | 76.8 | 9.6 |
| – Percent of Open Interest Shorts: | 19.6 | 65.4 | 12.1 |
| – Net Position: | -208,148 | 266,346 | -58,198 |
| – Gross Longs: | 250,387 | 1,792,747 | 223,471 |
| – Gross Shorts: | 458,535 | 1,526,401 | 281,669 |
| – Long to Short Ratio: | 0.5 to 1 | 1.2 to 1 | 0.8 to 1 |
| NET POSITION TREND: | |||
| – Strength Index Score (3 Year Range Pct): | 17.6 | 100.0 | 14.2 |
| – Strength Index Reading (3 Year Range): | Bearish-Extreme | Bullish-Extreme | Bearish-Extreme |
| NET POSITION MOVEMENT INDEX: | |||
| – 6-Week Change in Strength Index: | -35.4 | 33.8 | -4.9 |
Dow Jones Mini Futures:
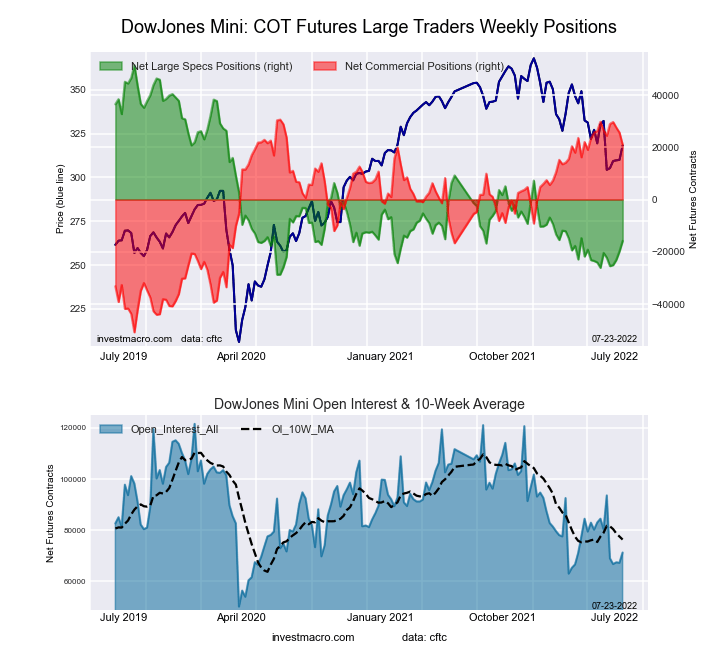
The Dow Jones Mini large speculator standing this week equaled a net position of -15,837 contracts in the data reported through Tuesday. This was a weekly gain of 4,006 contracts from the previous week which had a total of -19,843 net contracts.
This week’s current strength score (the trader positioning range over the past three years, measured from 0 to 100) shows the speculators are currently Bearish-Extreme with a score of 16.1 percent. The commercials are Bullish-Extreme with a score of 88.2 percent and the small traders (not shown in chart) are Bearish-Extreme with a score of 10.9 percent.
| Dow Jones Mini Futures Statistics | SPECULATORS | COMMERCIALS | SMALL TRADERS |
| – Percent of Open Interest Longs: | 24.6 | 59.9 | 14.6 |
| – Percent of Open Interest Shorts: | 46.9 | 30.4 | 21.8 |
| – Net Position: | -15,837 | 20,984 | -5,147 |
| – Gross Longs: | 17,567 | 42,667 | 10,371 |
| – Gross Shorts: | 33,404 | 21,683 | 15,518 |
| – Long to Short Ratio: | 0.5 to 1 | 2.0 to 1 | 0.7 to 1 |
| NET POSITION TREND: | |||
| – Strength Index Score (3 Year Range Pct): | 16.1 | 88.2 | 10.9 |
| – Strength Index Reading (3 Year Range): | Bearish-Extreme | Bullish-Extreme | Bearish-Extreme |
| NET POSITION MOVEMENT INDEX: | |||
| – 6-Week Change in Strength Index: | 5.7 | -6.8 | 5.0 |
Nasdaq Mini Futures:

The Nasdaq Mini large speculator standing this week equaled a net position of 28,117 contracts in the data reported through Tuesday. This was a weekly advance of 8,701 contracts from the previous week which had a total of 19,416 net contracts.
This week’s current strength score (the trader positioning range over the past three years, measured from 0 to 100) shows the speculators are currently Bullish-Extreme with a score of 90.7 percent. The commercials are Bearish-Extreme with a score of 14.5 percent and the small traders (not shown in chart) are Bearish with a score of 30.9 percent.
| Nasdaq Mini Futures Statistics | SPECULATORS | COMMERCIALS | SMALL TRADERS |
| – Percent of Open Interest Longs: | 30.0 | 54.2 | 13.5 |
| – Percent of Open Interest Shorts: | 19.0 | 61.9 | 16.8 |
| – Net Position: | 28,117 | -19,555 | -8,562 |
| – Gross Longs: | 76,826 | 139,088 | 34,491 |
| – Gross Shorts: | 48,709 | 158,643 | 43,053 |
| – Long to Short Ratio: | 1.6 to 1 | 0.9 to 1 | 0.8 to 1 |
| NET POSITION TREND: | |||
| – Strength Index Score (3 Year Range Pct): | 90.7 | 14.5 | 30.9 |
| – Strength Index Reading (3 Year Range): | Bullish-Extreme | Bearish-Extreme | Bearish |
| NET POSITION MOVEMENT INDEX: | |||
| – 6-Week Change in Strength Index: | 6.2 | -11.4 | 15.4 |
Russell 2000 Mini Futures:

The Russell 2000 Mini large speculator standing this week equaled a net position of -100,689 contracts in the data reported through Tuesday. This was a weekly lift of 17,089 contracts from the previous week which had a total of -117,778 net contracts.
This week’s current strength score (the trader positioning range over the past three years, measured from 0 to 100) shows the speculators are currently Bearish-Extreme with a score of 10.1 percent. The commercials are Bullish-Extreme with a score of 90.6 percent and the small traders (not shown in chart) are Bearish-Extreme with a score of 11.6 percent.
| Russell 2000 Mini Futures Statistics | SPECULATORS | COMMERCIALS | SMALL TRADERS |
| – Percent of Open Interest Longs: | 9.1 | 86.7 | 3.5 |
| – Percent of Open Interest Shorts: | 26.5 | 68.4 | 4.4 |
| – Net Position: | -100,689 | 105,868 | -5,179 |
| – Gross Longs: | 53,055 | 503,449 | 20,163 |
| – Gross Shorts: | 153,744 | 397,581 | 25,342 |
| – Long to Short Ratio: | 0.3 to 1 | 1.3 to 1 | 0.8 to 1 |
| NET POSITION TREND: | |||
| – Strength Index Score (3 Year Range Pct): | 10.1 | 90.6 | 11.6 |
| – Strength Index Reading (3 Year Range): | Bearish-Extreme | Bullish-Extreme | Bearish-Extreme |
| NET POSITION MOVEMENT INDEX: | |||
| – 6-Week Change in Strength Index: | -15.3 | 14.8 | -4.0 |
Nikkei Stock Average (USD) Futures:

The Nikkei Stock Average (USD) large speculator standing this week equaled a net position of -3,127 contracts in the data reported through Tuesday. This was a weekly reduction of -1,176 contracts from the previous week which had a total of -1,951 net contracts.
This week’s current strength score (the trader positioning range over the past three years, measured from 0 to 100) shows the speculators are currently Bullish with a score of 62.6 percent. The commercials are Bearish with a score of 46.4 percent and the small traders (not shown in chart) are Bearish with a score of 25.6 percent.
| Nikkei Stock Average Futures Statistics | SPECULATORS | COMMERCIALS | SMALL TRADERS |
| – Percent of Open Interest Longs: | 17.0 | 61.9 | 20.9 |
| – Percent of Open Interest Shorts: | 40.5 | 36.8 | 22.5 |
| – Net Position: | -3,127 | 3,341 | -214 |
| – Gross Longs: | 2,269 | 8,241 | 2,783 |
| – Gross Shorts: | 5,396 | 4,900 | 2,997 |
| – Long to Short Ratio: | 0.4 to 1 | 1.7 to 1 | 0.9 to 1 |
| NET POSITION TREND: | |||
| – Strength Index Score (3 Year Range Pct): | 62.6 | 46.4 | 25.6 |
| – Strength Index Reading (3 Year Range): | Bullish | Bearish | Bearish |
| NET POSITION MOVEMENT INDEX: | |||
| – 6-Week Change in Strength Index: | -21.8 | 14.5 | 21.3 |
MSCI EAFE Mini Futures:
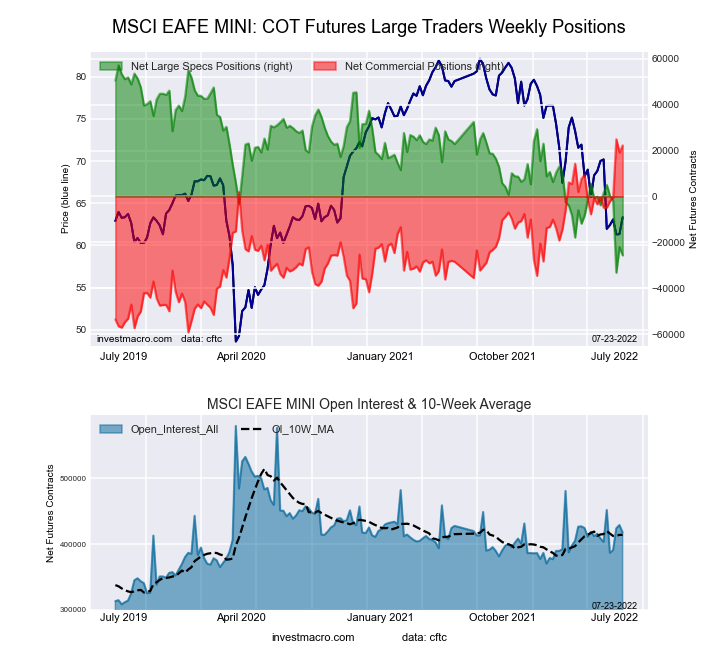
The MSCI EAFE Mini large speculator standing this week equaled a net position of -25,673 contracts in the data reported through Tuesday. This was a weekly decrease of -3,637 contracts from the previous week which had a total of -22,036 net contracts.
This week’s current strength score (the trader positioning range over the past three years, measured from 0 to 100) shows the speculators are currently Bearish-Extreme with a score of 8.5 percent. The commercials are Bullish-Extreme with a score of 96.8 percent and the small traders (not shown in chart) are Bearish with a score of 48.9 percent.
| MSCI EAFE Mini Futures Statistics | SPECULATORS | COMMERCIALS | SMALL TRADERS |
| – Percent of Open Interest Longs: | 5.5 | 91.6 | 2.2 |
| – Percent of Open Interest Shorts: | 11.6 | 86.3 | 1.4 |
| – Net Position: | -25,673 | 22,245 | 3,428 |
| – Gross Longs: | 22,869 | 382,761 | 9,198 |
| – Gross Shorts: | 48,542 | 360,516 | 5,770 |
| – Long to Short Ratio: | 0.5 to 1 | 1.1 to 1 | 1.6 to 1 |
| NET POSITION TREND: | |||
| – Strength Index Score (3 Year Range Pct): | 8.5 | 96.8 | 48.9 |
| – Strength Index Reading (3 Year Range): | Bearish-Extreme | Bullish-Extreme | Bearish |
| NET POSITION MOVEMENT INDEX: | |||
| – 6-Week Change in Strength Index: | -30.9 | 32.2 | 1.6 |
*COT Report: The COT data, released weekly to the public each Friday, is updated through the most recent Tuesday (data is 3 days old) and shows a quick view of how large speculators or non-commercials (for-profit traders) were positioned in the futures markets.
The CFTC categorizes trader positions according to commercial hedgers (traders who use futures contracts for hedging as part of the business), non-commercials (large traders who speculate to realize trading profits) and nonreportable traders (usually small traders/speculators) as well as their open interest (contracts open in the market at time of reporting).See CFTC criteria here.
More By This Author:
COT Week 28 Charts: Stock Market Speculators Bets Declined Overall Led By S&P500-Mini & VIX
COT Week 28 Charts: Energy Speculator Bets Mixed Led By Gasoline & Heating Oil
COT Week 28 Charts: Soft Commodities Speculators Bets Drop Lower Led By Corn, Coffee & Soybeans


Comments
Log in or sign up to join the conversation.