
S. Ren in Bloomberg: “It’s getting flatter, prompting worries over an ‘asset famine’ and a prolonged recession.”
Whatever the reason, an inverted yield curve has a bad rap. In normal times, notes with longer maturities offer higher rates to compensate lenders for tying up their money for an extended period. When those yields sink close to or below shorter ones, it’s an indication that investors are pessimistic about an economy’s growth prospects. In the US, an inversion was a reliable predictor of recessions, at least in the pre-pandemic days.
Here’s a picture of the Chinese yield curve as of today:
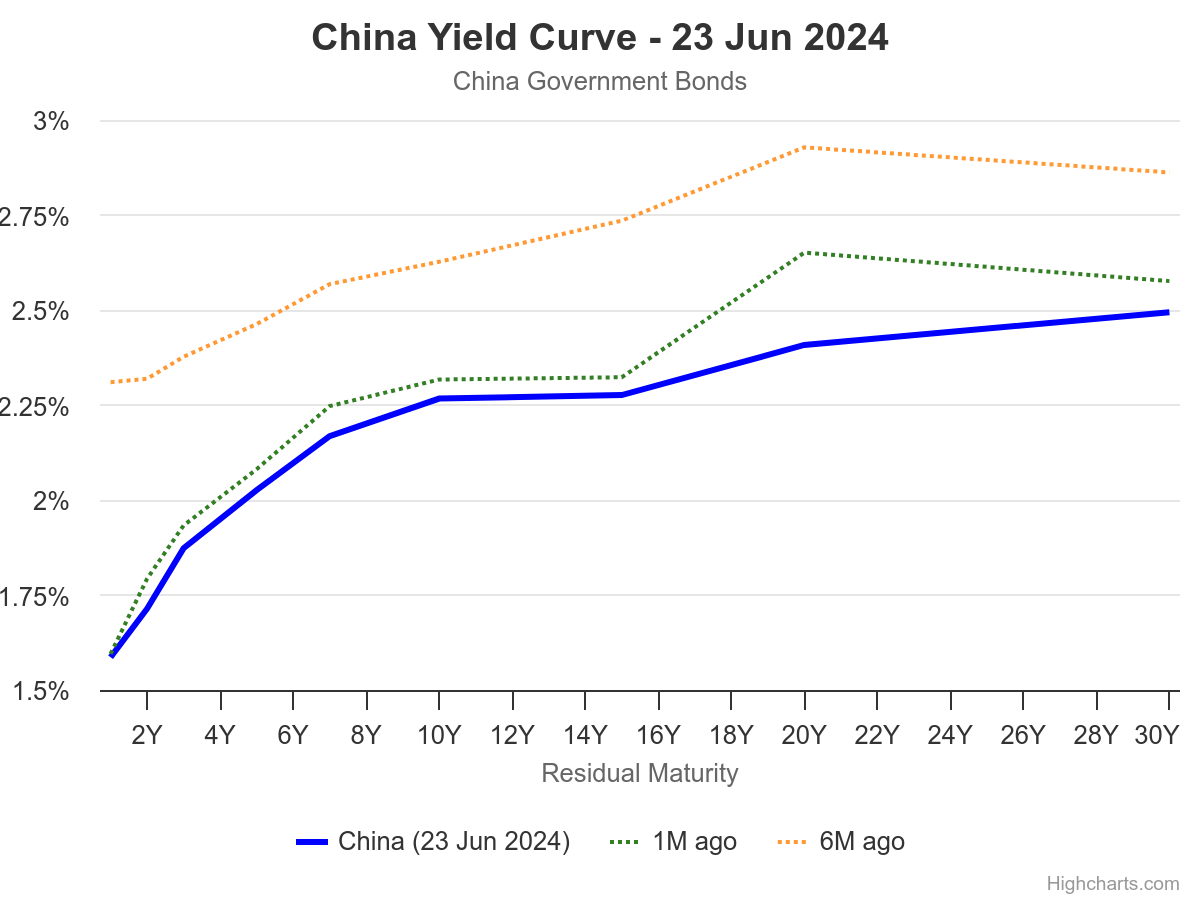
Source: WorldGovernmentBonds.com.
There’s no inversion at maturities 1 year to 30. However, the 10yr-3mo spread is inverted.
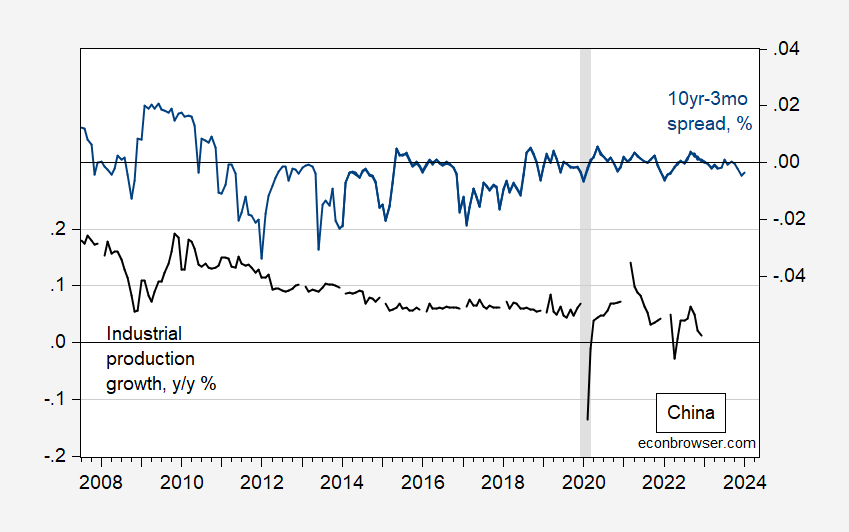
Figure 1: Chinese year-on-year industrial production growth (black, left scale), and 10yr-3mo spread (blue, right scale). ECRI defined peak-to-trough recession dates shaded gray. Source: OECD, and author’s calculations.
Chinn and Ferrara (2024) examine the predictability of Chinese recessions and industrial production growth. In the former, no results can be obtained, given the paucity of recessions during periods when long term interest rates are available (or relevant, given financial repression). For y/y industrial production growth, we obtain:
ipgrowth = 0.095 + 1.66 × spread
Adj-R2 = 0.26, NObs = 131, Sample = 2007M07-2018M12 (growth to 2019M12). Bold indicates significance at 10% msl using HAC robust standard errors.
While there’s a statistically significant positive association between the spread and growth, it’s not a major explanatory factor. This is perhaps unsurprising insofar as the long term government bond market in China is not very liquid. The long term bond yield is strongly related to expected future short rates (i.e., the expectations hypothesis of the term structure) if the long term marked is liquid.
Adding in additional financial factors — specifically the debt service ratio and foreign term spread — increases the adjusted R2 to about 0.77.
ipgrowth = 0.237 + 0.32 × spread – 0.98 × dsr + 1.44 × spread*
Adj-R2 = 0.77, NObs = 131, Sample = 2007M07-2018M12 (growth to 2019M12). Bold indicates significance at 10% msl using HAC robust standard errors.
While the spread remains marginally significant, in terms of standardized coefficients, the debt-service ratio and foreign term term spread are more impactful (7 and 3 times more than term spread, respectively).
Here’s the BIS series for private nonfinancial sector debt service ratio, through 2023.
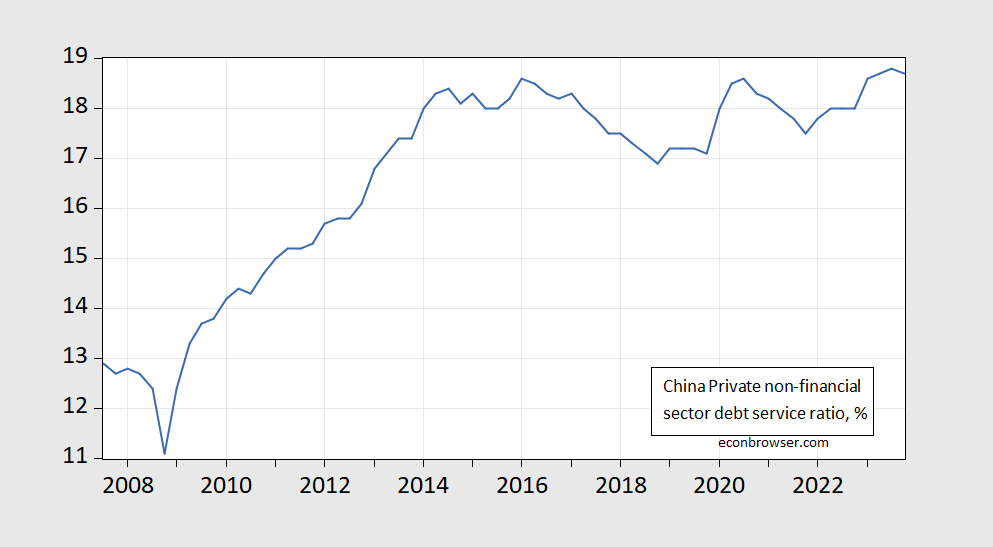
Figure 2: Chinese private nonfinancial sector debt service ratio, %. Source: BIS.
For signals of an impending recession — or recession — look to other indicators.
Earlier post on China, here.
More By This Author:
Some Recent Statistics On The Internationalization Of The Yuan
June CBO Economic Outlook: Positive Output Gap Through 2025
Business Cycle Indicators, Mid-June


Comments
Log in or sign up to join the conversation.